
Tanzania’s Industrial Output Fell 3.6% in Early 2026 as Mining and Manufacturing Lost Momentum
Ready
Tanzania entered 2026 with weaker industrial momentum as mining, manufacturing and water related output declined from the fourth quarter, although annual production remained higher, supported by electricity and selected manufacturing industries. The country's industrial output fell 3.6 percent from the final quarter of 2025 as mining and manufacturing weakened, but year on year production remained higher, showing an industrial economy that lost momentum rather than one experiencing a broad annual contraction.
Tanzania’s industrial production fell 3.6 percent in the first quarter of 2026 compared with the final three months of 2025, as mining, manufacturing and water related activities all weakened, indicating that the industrial economy entered the year with less momentum even though total production remained above the level recorded a year earlier.
The National Bureau of Statistics Index of Industrial Production Release for January to March 2026, published on May 29, shows the overall industrial production index declining from 114.3 in the fourth quarter of 2025 to 110.2 in the first quarter of 2026. Water supply, sewerage, waste management and remediation activities recorded the sharpest quarterly decline at 9.3 percent, mining and quarrying fell 4.9 percent, manufacturing declined 3.6 percent and electricity, gas, steam and air conditioning supply edged down 0.4 percent.
The quarterly decline does not mean Tanzania’s industrial sector was smaller than it was at the beginning of 2025. On a year on year basis, the overall index increased from 107.5 in the first quarter of 2025 to 110.2 in the first quarter of 2026, representing growth of 2.6 percent. Electricity production increased 6.3 percent over the same period and manufacturing rose 4.8 percent, partially offsetting weaker mining and water related output.
That distinction is important for interpreting Tanzania’s industrial trajectory. The economy was still producing more industrial output than it had twelve months earlier, but activity had slowed from the stronger levels reached at the end of 2025. The first quarter data therefore point less to a broad industrial recession than to a loss of short term momentum, with some sectors correcting sharply after stronger production during the previous quarter.
The Index of Industrial Production is intended to capture those changes in physical output before they become fully visible in broader economic indicators. NBS uses the index to measure short term movements across mining and quarrying, manufacturing, electricity and utilities, making it one of the more immediate indicators of whether the productive side of the economy is accelerating or slowing.
Manufacturing Remains Larger Than a Year Ago, but the Quarter Was Weak
Manufacturing carries the largest weight in Tanzania’s industrial production index at 58 percent, making its performance particularly important to the overall direction of industrial output. The manufacturing index fell from 116.5 in the fourth quarter of 2025 to 112.3 in the first quarter of 2026, a 3.6 percent quarterly decline, although it remained 4.8 percent above the level recorded in the first quarter of 2025.
The internal composition of manufacturing was highly uneven. Electrical equipment production fell 24.1 percent quarter on quarter, tobacco products declined 12.9 percent according to the detailed industrial table, beverages fell 9.4 percent, pharmaceutical products and preparations decreased 8.4 percent, refined petroleum products fell 5.8 percent and furniture declined 4.4 percent.
The performance of beverages matters particularly because the industry carries a weight of 14.5 percent within the industrial index, making it one of the most influential manufacturing categories. Its index fell from 153.1 in the fourth quarter of 2025 to 138.8 in the first quarter of 2026, leaving output 3.6 percent below the corresponding period of 2025.
Food production, which carries a weight of 12.6 percent, was considerably more stable, increasing 0.7 percent from the previous quarter and 1.5 percent year on year. The contrast between food and beverages shows why the aggregate manufacturing number can hide significant differences between industries that respond to different demand conditions, production cycles and input costs.
Pharmaceutical manufacturing presents another area to watch. Production fell 8.4 percent quarter on quarter and 9.8 percent from the first quarter of 2025, while chemicals and chemical products were still 9.4 percent below their level a year earlier despite improving slightly during the quarter.
For a country trying to reduce dependence on imported manufactured goods and deepen domestic value addition, sustained weakness in pharmaceuticals, chemicals and electrical equipment would matter beyond the index itself because these industries sit closer to the type of higher value production Tanzania has been trying to expand.
Metals and Machinery Were Among the Stronger Areas
The manufacturing data also contain several positive signals. Fabricated metal products increased 19.3 percent during the quarter and 25.7 percent year on year, while machinery and equipment production rose 13.3 percent quarter on quarter and 10.9 percent from a year earlier. Rubber and plastics increased 12.2 percent from the previous quarter and 8.4 percent year on year.
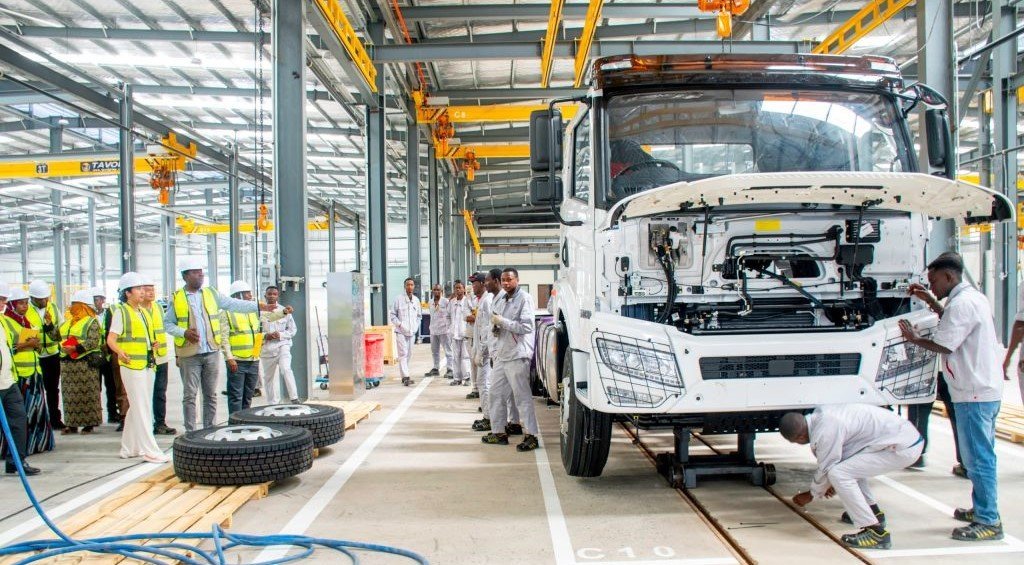
Basic metals were down slightly from the previous quarter, but production remained 16.9 percent above the first quarter of 2025. Non metallic mineral products, which include materials associated with construction and industrial processing, were 14.9 percent higher than a year earlier despite declining 3.5 percent from the fourth quarter. Motor vehicles, trailers and semi trailers were also 9 percent above their year earlier level.
These categories suggest that parts of Tanzania’s manufacturing base linked to construction materials, metal processing, machinery and industrial inputs remained stronger than several consumer and specialised manufacturing categories.
That pattern is economically relevant because metal fabrication, machinery and industrial materials can be indicators of activity deeper within investment and construction supply chains. When those sectors expand, they can reflect demand associated with infrastructure, housing, industrial equipment and domestic capital formation rather than household consumption alone.
The strength of fabricated metal products is especially notable because production was more than a quarter higher than a year earlier, while machinery production was also in positive territory. If those trends persist, they could indicate a gradual broadening of Tanzania’s manufacturing base beyond food processing and traditional consumer goods, although one quarter of data is not sufficient to establish a structural shift.
Mining Was the Main Drag on the Annual Industrial Picture
Mining and quarrying accounted for 28.8 percent of the industrial production index and performed more weakly than manufacturing. The mining index fell from 94.9 in the fourth quarter of 2025 to 90.2 in the first quarter of 2026, a decline of 4.9 percent, and was 4.2 percent below the first quarter of the previous year.
Metal ore mining, which carries most of the sector’s weight, fell 3.4 percent quarter on quarter and 4.8 percent year on year, while other mining and quarrying declined 11 percent from the previous quarter and 1.6 percent compared with early 2025.
The weakness is notable because mining has become one of Tanzania’s more important sources of exports, foreign exchange and investment. A prolonged decline in physical production could eventually affect export receipts even if mineral prices remain supportive, while stronger output would reinforce the contribution of gold, industrial minerals and other resources to external earnings.
The first quarter figures do not establish that Tanzania’s mining sector has entered a sustained contraction because production can fluctuate according to mine schedules, ore grades, maintenance and individual project cycles. They do, however, show that mining did not contribute positively to industrial growth at the start of 2026 and instead offset part of the expansion recorded in electricity and manufacturing.
Electricity Remained the Strongest Broad Industrial Sector Year on Year
Electricity, gas, steam and air conditioning supply was the strongest of the broad industrial categories on a year on year basis, increasing 6.3 percent from the first quarter of 2025. The sector’s index stood at 147.2 in the first quarter of 2026 compared with 138.6 a year earlier, although output was almost unchanged from the fourth quarter, declining only 0.4 percent.
The electricity number is important because power production is both an industrial activity in its own right and an input into almost every other productive sector. Higher electricity supply can support manufacturing, mining and services, but whether additional generation translates into stronger industrial output depends on demand, reliability, transmission capacity and the ability of businesses to expand production.
The contrast between stronger annual electricity output and weaker quarterly manufacturing and mining therefore suggests that power availability alone was not sufficient to prevent the first quarter slowdown. Demand conditions, industrial operating cycles and sector specific constraints likely played larger roles in determining production during the period, although the NBS release does not assign causality beyond the production data themselves.
Water supply, sewerage, waste management and remediation recorded the largest broad sector decline during the quarter at 9.3 percent and was 3.8 percent below the level recorded a year earlier. Its weight in the overall industrial index is comparatively small at 1.5 percent, meaning its influence on the aggregate result was limited despite the sharp percentage movement.
The Data Show a Mixed Industrial Economy, Not a Uniform Slowdown
The first quarter figures reveal substantial differences beneath the headline 3.6 percent decline. Electrical equipment, pharmaceuticals, beverages and mining weakened, while fabricated metals, machinery, rubber and plastics, and several other manufacturing categories expanded. Some industries were weaker than the previous quarter but still considerably stronger than they had been a year earlier.
Tobacco manufacturing is one of the clearest examples. Production fell sharply from the fourth quarter but remained 77 percent higher than in the first quarter of 2025, illustrating how quarter on quarter and year on year comparisons can produce very different pictures when production is volatile. Wood products were 26.2 percent higher than a year earlier, while fabricated metals increased 25.7 percent and basic metals rose 16.9 percent.
Electrical equipment moved in the opposite direction, declining 24.1 percent quarter on quarter and 20.6 percent from a year earlier, making it one of the clearest areas of sustained weakness in the report. Leather products, pharmaceuticals, paper products and chemicals were also below their first quarter 2025 levels.
This dispersion matters because Tanzania’s industrialisation challenge is not simply about increasing total production. The structure of that production determines whether the economy is moving toward more sophisticated manufacturing, deeper domestic supply chains and higher value addition.
Growth concentrated in metals, machinery and industrial materials can support construction and capital formation, while persistent declines in pharmaceuticals, chemicals and electrical equipment would indicate continued weaknesses in sectors where Tanzania has strategic reasons to expand domestic capacity.
The Second Quarter Will Show Whether the Slowdown Was Temporary
The first quarter of a year can be affected by seasonality, maintenance cycles and the unwinding of stronger year end production, which means the 3.6 percent quarterly decline should not be interpreted on its own as evidence of a sustained industrial downturn.
The annual comparison remains positive. Overall industrial output was 2.6 percent higher than a year earlier, manufacturing was up 4.8 percent and electricity production increased 6.3 percent. Those figures indicate that Tanzania’s industrial base remained larger than it had been in early 2025.
The weaker quarterly trajectory nevertheless deserves attention because industrial production had reached an index level of 114.3 at the end of 2025 before falling to 110.2. A return toward or above that level in subsequent quarters would indicate that the first quarter decline was largely temporary. Continued weakness would suggest that the industrial sector had entered a slower phase despite remaining above its 2025 starting point.
The composition of future growth will be equally important. Tanzania’s industrial ambitions depend not only on expanding the volume of manufacturing but on increasing the share of products that embody greater processing, technology and domestic value addition. Metals and machinery provided encouraging signals in the first quarter, while electrical equipment, pharmaceuticals and chemicals moved in the opposite direction.
The January to March 2026 data therefore present a more nuanced picture than either a headline contraction or a headline annual increase would suggest. Tanzania’s industrial economy is still larger than it was a year earlier, but it started 2026 with weaker momentum, and the next quarters will determine whether that slowdown was a temporary adjustment or the beginning of a more persistent loss of pace.
 Uchumi360
Business Intelligence
- Source: National Bureau of Statistics, Index of Industrial Production Release for January to March 2026, May 29, 2026
Uchumi360 covers business, investment, and economic policy across East, Central, and Southern Africa.
For the serious reader
You read to the end. That places you in a small group.
Uchumi360 is built for readers who demand precision over speed, structure over sentiment, and analysis that holds uncomfortable conclusions rather than softening them. If this work sharpens how you think about Africa's economy, help us keep building the infrastructure behind it.
Institutional Partners
Commission intelligence. Shape the conversation.
Uchumi360 works with development finance institutions, investment firms, sovereign bodies, and strategic organisations across the coverage region. Institutional partnership unlocks:
- Commissioned sector and country intelligence reports
- Branded research series under your institution's authority
- Exclusive data briefings for internal strategy teams
- Speaking and editorial presence at Uchumi360 events
- Co-published investment outlooks for your markets
Support Our Work
Independent analysis has a cost. Help us bear it.
Uchumi360 does not carry advertising. It does not take editorial direction from sponsors. Every article is produced without commercial compromise. Your contribution funds the reporting, research, and editorial infrastructure that keeps this analysis free from influence.
Secure checkout: One-time and monthly support are processed securely. Add payment credentials to enable checkout here.
Stay Connected
Keep up with every new insight.
Follow our latest analysis, policy coverage, and market intelligence as soon as it is published. If you need something specific, reach out directly and we will point you to the right research.
