For the First Time in History, Tanzania's CRDB and NMB Bank Rank Above Kenya's Equity and KCB. East Africa's Corporate Landscape Is Shifting.
Ready
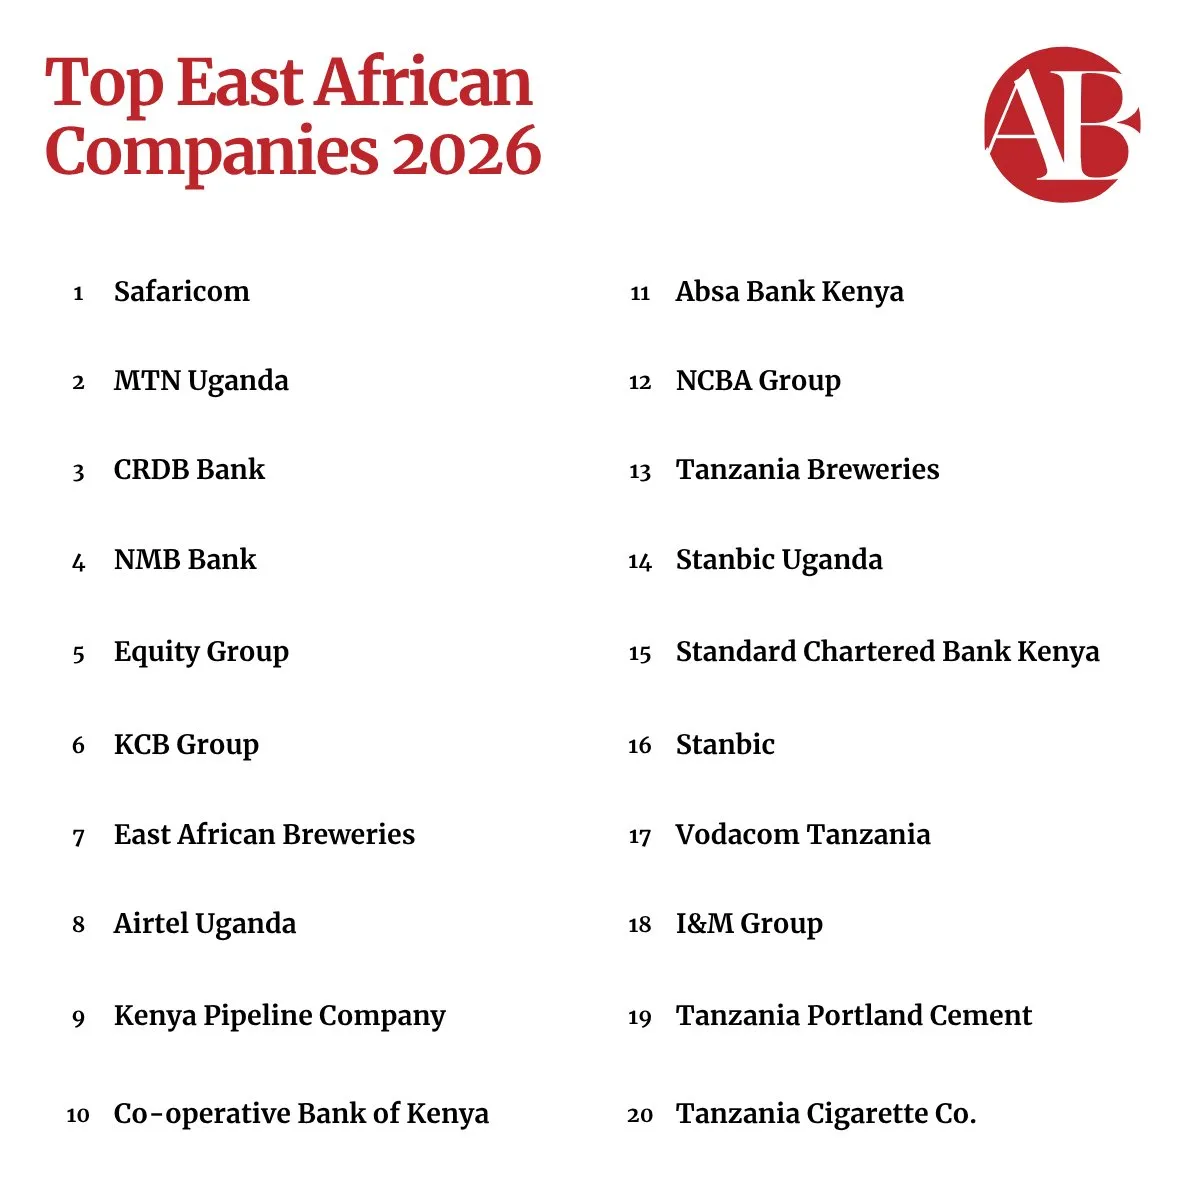
African Business magazine's Top East African Companies 2026 survey, sourced from the publication's broader Top 250 Companies in Africa 2026 research, reveals that CRDB Bank and NMB Bank have each reached USD 2.7 billion in market capitalisation, placing Tanzania's largest banks above Kenya's Equity Group and KCB Group in the regional ranking for the first time in the survey's history. Safaricom remains the region's largest company by a wide margin at USD 8.4 billion market capitalisation, recording a 55% increase in half-year profits to KSh 65.2 billion for the six months to September 2025 driven by improved performance in Ethiopia and M-Pesa revenue growth to KSh 88.1 billion. The number of East African companies valued above USD 1 billion has risen from eight in the 2025 survey to fourteen in 2026. The top twenty includes eleven Kenyan companies, six Tanzanian, and three Ugandan. Tanzania's banking sector recorded total net profits of TZS 2.47 trillion, approximately USD 950 million, in 2025, a 14.7% increase on 2024 which itself was a 40.9% increase on 2023. Total Tanzania banking sector assets reached TZS 79.4 trillion, approximately USD 3.05 billion, in 2025. CRDB and NMB together account for 60% of total Tanzanian banking profits. The survey's sector breakdown shows banking and telecoms dominating the top twenty with oil and gas, beverages, construction materials, and tobacco representing smaller but present diversification. This article reports the rankings, analyses the Tanzania banking story, situates Safaricom's continued dominance, and identifies what the corporate landscape shift reveals about East Africa's broader economic trajectory. Tanzania's banks overtaking Kenya's in the regional ranking is not simply a corporate milestone. It is a signal about which economy's productive activity is growing fastest and whose capital markets are pricing that growth most aggressively. The shift deserves more analytical attention than a ranking update.
For the first time in East African corporate history, Tanzania's two largest banks outrank their Kenyan counterparts in the region's most authoritative company survey.
African Business magazine's Top East African Companies 2026 survey places CRDB Bank third and NMB Bank fourth in the regional ranking, each with a market capitalisation of USD 2.7 billion, putting them ahead of Kenya's Equity Group at fifth and KCB Group at sixth. It is, as the survey's authors note, one of the most striking developments in this year's rankings.
The valuation movements that produced this outcome are substantial. CRDB Bank's market capitalisation rose from USD 762 million to USD 2.7 billion over twelve months, an increase of more than 250%. NMB Bank climbed from USD 1.1 billion to USD 2.7 billion over the same period. Both movements place the banks in the billion-dollar company category whose membership across East Africa has itself expanded significantly, from eight companies in the 2025 survey to fourteen in 2026.
Safaricom's continued dominance and what drives it
Safaricom remains the biggest company in East Africa by a wide margin, with a market capitalisation of USD 8.4 billion that places it substantially ahead of the tightly packed group behind it. The Kenyan telecoms company recorded a 55% increase in half-year profits for the six months to the end of September 2025 to KSh 65.2 billion, approximately USD 501 million, driven by two factors whose combination explains the scale of the improvement.
Ethiopia is the first. Safaricom launched in Ethiopia in 2022 following deregulation in Kenya's northern neighbour, and while the operation has registered losses in its early years, the loss for the half year to September was 59% lower than in the same period in 2024, indicating a trajectory whose improvement is beginning to contribute positively to the group's overall performance rather than simply representing a growth investment whose costs are being absorbed by the Kenyan operation.
M-Pesa is the second. Mobile financial service revenue rose by KSh 10.9 billion to KSh 88.1 billion, approximately USD 678 million, for the half year, confirming that M-Pesa's financial services ecosystem continues expanding its transaction volume, merchant acceptance, and product breadth at a pace whose contribution to Safaricom's overall revenue is growing relative to the traditional airtime and data services whose commoditisation has compressed margins across the telecoms sector more broadly.
The Tanzania banking story and what it reveals
Tanzania's banking sector recorded total net profits of TZS 2.47 trillion, approximately USD 950 million, in 2025, representing a 14.7% increase on 2024 which itself was a 40.9% increase on 2023. Total Tanzania banking sector assets reached TZS 79.4 trillion, approximately USD 3.05 billion, in 2025. The compounding growth across consecutive years confirms that Tanzania's banking expansion is structural rather than cyclical, reflecting the real economy growth whose financing the banking sector is intermediating rather than a temporary credit cycle whose reversal would expose the profit growth as unsustainable.
CRDB and NMB together account for 60% of total Tanzanian banking profits, a concentration that the survey notes contrasts sharply with the income declines registered by the Tanzanian operations of some foreign-owned banks. The two institutions' domestic market dominance reflects the competitive advantage that local institutional knowledge, relationship depth, and balance sheet scale create in banking markets whose growth is driven primarily by domestic economic activity rather than by cross-border financial services whose profitability benefits internationally connected institutions more than domestically focused ones.
The banking sector's growth connects directly to the infrastructure and industrial investment trajectory that Uchumi360 has documented across its May 2026 coverage. An economy building railways at USD 2.33 billion for a single financing package, advancing toward a USD 42 billion LNG project, commissioning the Julius Nyerere Hydropower Project, and expanding port infrastructure simultaneously is generating the construction financing, project lending, trade finance, and corporate banking demand whose intermediation produces the profit growth Tanzania's banking sector is recording at the pace the survey documents. Banking profits are a signal about the productive economy underneath them, and Tanzania's compounding banking profit growth across 2023, 2024, and 2025 is the financial sector expression of the physical economy transformation whose infrastructure investments are the most visible component.
Kenya's continued regional corporate leadership and its character
The top twenty's composition of eleven Kenyan companies, six Tanzanian, and three Ugandan confirms Kenya's continued regional corporate leadership while situating that leadership within a competitive landscape whose dynamics are shifting more rapidly than the total company count suggests. Kenya's financial depth, private sector sophistication, and the Nairobi Securities Exchange's capital market development create the corporate ecosystem whose breadth produces more top-twenty companies than any regional peer, but the survey's specific finding that CRDB and NMB now outrank Equity and KCB on market capitalisation despite Kenya's overall banking sector remaining far stronger than Tanzania's introduces the distinction between breadth and depth that the ranking's detail requires to be interpreted correctly.
Kenya's eleven top-twenty companies span a broader sectoral range than Tanzania's six, covering telecoms through Safaricom, banking through Equity Group, KCB Group, Co-operative Bank of Kenya, Absa Bank Kenya, NCBA Group, and Standard Chartered Bank Kenya, beverages through East African Breweries, oil and gas infrastructure through Kenya Pipeline Company, and financial services through I&M Group. Tanzania's six companies are more concentrated in banking, with CRDB Bank, NMB Bank, Tanzania Breweries, Vodacom Tanzania, Tanzania Portland Cement, and Tanzania Cigarette Company representing the Dar es Salaam Stock Exchange's listed company depth whose narrower sectoral distribution reflects the manufacturing and industrial complexity gap that Uchumi360's industrial series has consistently identified as Tanzania's most consequential structural development challenge.
Uganda's three companies, MTN Uganda at second in the overall ranking, Airtel Uganda at eighth, and Stanbic Uganda at fourteenth, reflect the telecoms and banking concentration that characterises East Africa's corporate landscape more broadly, with MTN Uganda's second-place ranking the most striking Ugandan result and a reflection of the telecoms operator's Uganda business performance rather than the oil sector whose commercial production is approaching but has not yet reached the financial scale that would produce listed corporate valuations in the top-twenty range.
What the sector breakdown reveals about East Africa's corporate economy
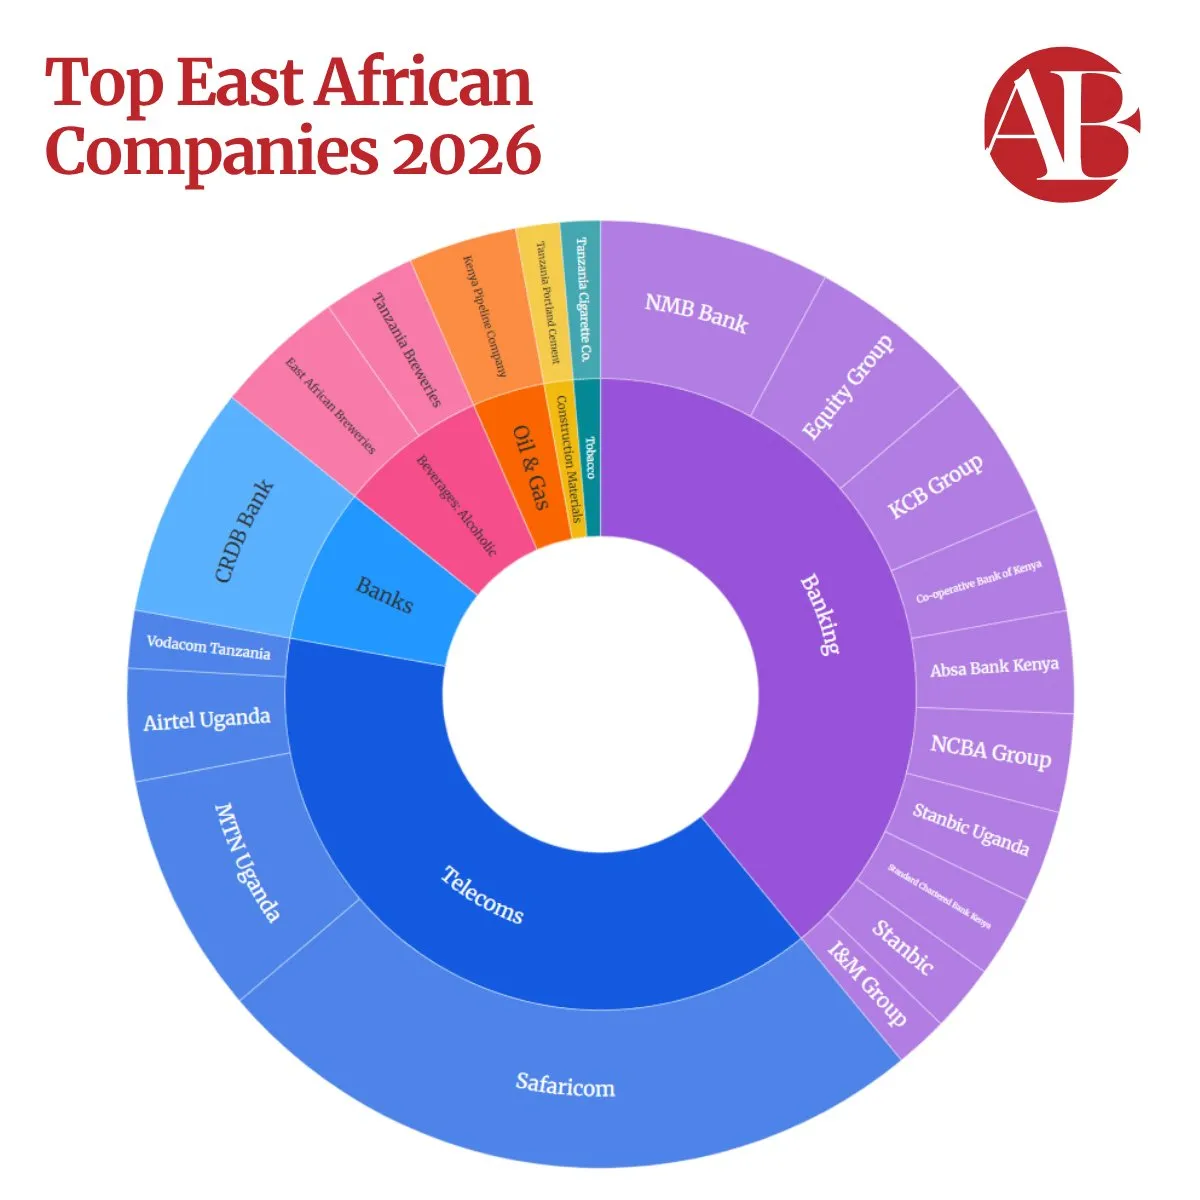
The donut chart breakdown of the top twenty by sector reveals the structural character of East Africa's corporate economy with a clarity that the ranked list alone does not provide. Banking dominates the regional corporate landscape, with nine of the top twenty companies operating primarily as banks whose combined market capitalisation substantially exceeds any other sector. Telecoms is the second-largest sector with Safaricom, MTN Uganda, Airtel Uganda, and Vodacom Tanzania, whose combined weighting reflects the mobile economy's central role in East African commerce, financial services, and consumer activity. Beverages through East African Breweries and Tanzania Breweries, oil and gas through Kenya Pipeline Company, construction materials through Tanzania Portland Cement, and tobacco through Tanzania Cigarette Company represent the industrial and consumer goods companies whose presence in the top twenty confirms that productive economic activity beyond financial intermediation and telecoms infrastructure is generating the corporate value whose listing provides the capital market signal that investment decisions respond to.
The sector distribution's most analytically significant implication for East Africa's industrial development trajectory is the absence from the top twenty of manufacturing companies whose products go beyond beverages, cement, and cigarettes into the industrial goods, processed foods, chemicals, textiles, pharmaceuticals, and engineering products that characterise the corporate landscapes of more industrially complex economies. The Harvard Growth Lab Economic Complexity Index's consistent finding that economies become wealthy not by producing more things but by producing more sophisticated things whose manufacture generates the engineering learning and supply chain depth that compound into productive sophistication is visible in East Africa's top-twenty sector distribution. Banking and telecoms intermediation does not generate the productive complexity that industrial manufacturing creates, and the corporate landscape whose composition reflects financial and digital intermediation more than industrial production is a signal about the productive structure whose development Uchumi360's industrial series has identified as the binding constraint on East Africa's long-run wealth creation.
What the billion-dollar company expansion means
The increase in East African companies valued above USD 1 billion from eight in the 2025 survey to fourteen in 2026 is the single most consequential aggregate finding in the rankings for understanding the pace of East Africa's corporate development. A near-doubling of billion-dollar companies in a single year reflects the combination of real economic growth, currency and market valuation dynamics, and investor confidence improvements whose combined effect on listed company valuations produces the threshold crossings that the billion-dollar count captures. The survey's note that Tanzania Cigarette Company at twentieth with a USD 471 million valuation represents a significant increase on the USD 270 million Tanzania Portland Cement needed to secure the same position in the 2025 table confirms that the growth is not confined to the very largest companies but is being generated across the corporate size distribution, reflecting an economic expansion whose breadth is producing corporate value creation at multiple scales simultaneously.
Tanzania's banking sector growth, whose 2025 net profit of approximately USD 950 million and 14.7% year-on-year increase Uchumi360 has reported from African Business survey data, and Kenya's continued corporate leadership whose eleven top-twenty companies reflect the private sector depth that decades of market development has produced, together describe a regional corporate landscape whose growth trajectory is among the most dynamic in Africa. The infrastructure decade that Tanzania, Kenya, Uganda, and Rwanda are simultaneously entering, with the railways, ports, refineries, energy systems, and logistics corridors whose construction is creating the productive economy that corporate valuations reflect, is the context within which the 2026 survey's findings are most consequentially situated.
The corporate map of East Africa is being redrawn. Tanzania's banks are now above Kenya's in the regional ranking for the first time. The productive economy whose growth they are financing is the reason why.
FAQ
What is the most significant finding in the Top East African Companies 2026 survey? For the first time in East African corporate history, Tanzania's CRDB Bank and NMB Bank rank above Kenya's Equity Group and KCB Group in the regional company survey. CRDB's market capitalisation rose from USD 762 million to USD 2.7 billion over twelve months and NMB's from USD 1.1 billion to USD 2.7 billion, placing both third and fourth respectively in the regional ranking behind only Safaricom at USD 8.4 billion and MTN Uganda at second.
Why has Tanzania's banking sector grown so strongly? Tanzania's banking sector recorded net profits of TZS 2.47 trillion, approximately USD 950 million, in 2025, a 14.7% increase on 2024 which itself was a 40.9% increase on 2023. The compounding growth reflects the real economy expansion whose financing the banking sector is intermediating, specifically the infrastructure investment, construction activity, trade finance, and corporate banking demand generated by Tanzania's SGR expansion, port modernisation, energy infrastructure, and industrial investment programme whose scale Uchumi360 has documented across its 2026 coverage. CRDB and NMB together account for 60% of total Tanzanian banking profits, with their domestic market dominance producing returns that contrast with the income declines recorded by some foreign-owned Tanzanian banks.
How does Kenya's corporate position compare to Tanzania's after the 2026 survey? Eleven of the top twenty East African companies are Kenyan, six are Tanzanian, and three are Ugandan. Kenya's overall banking sector remains far stronger than Tanzania's, with more large banks operating in its domestic market across a broader sectoral distribution. However, Tanzania's CRDB and NMB now individually outrank Kenya's Equity Group and KCB Group on market capitalisation, reflecting Tanzania's faster banking sector growth rate rather than Kenya's absolute corporate position, which remains the region's strongest by company count and sectoral breadth.
What does the sector breakdown of the top twenty reveal about East Africa's corporate economy? Banking dominates with nine of the top twenty companies, followed by telecoms with four companies including Safaricom, MTN Uganda, Airtel Uganda, and Vodacom Tanzania. Beverages, oil and gas infrastructure, construction materials, and tobacco represent smaller but present diversification. The absence of manufacturing companies beyond beverages, cement, and tobacco from the top twenty reflects the productive complexity gap that Uchumi360's industrial series has identified as East Africa's most consequential structural development challenge, with financial and digital intermediation dominating corporate value creation rather than the industrial manufacturing whose presence in a corporate landscape signals the productive sophistication that long-run wealth creation requires.
What does the expansion from eight to fourteen billion-dollar companies mean? The near-doubling of East African companies valued above USD 1 billion in a single year reflects the combination of real economic growth, investor confidence improvements, and corporate performance across the region whose breadth is confirmed by the survey's finding that even the twentieth-ranked company's valuation has increased significantly from the previous year's equivalent threshold. The expansion is not confined to the largest companies but reflects corporate value creation across the size distribution, indicating an economic expansion whose pace is generating investable corporate assets at multiple scales simultaneously.
 Uchumi360
Business Intelligence
Uchumi360
Business Intelligence
- African Business magazine, Top East African Companies 2026 survey
- All company rankings, market capitalisation figures, profit data, and sector breakdowns cited from this survey as published
- Available at african.business
- African Business magazine, Top 250 Companies in Africa 2026
- Regional survey source data
- Available at african.business
- Safaricom PLC, half-year results for six months to September 2025
- KSh 65.2 billion profit, 55% increase, KSh 88.1 billion M-Pesa revenue, Ethiopia loss reduction of 59%
- Available at safaricom.co.ke
- Bank of Tanzania, banking sector performance data
- TZS 2.47 trillion net profits 2025, 14.7% increase on 2024, 40.9% increase 2023 to 2024, TZS 79.4 trillion total assets 2025
- Verify against BOT most recent banking sector surveillance report before publication
- Available at bot.go.tz
- Dar es Salaam Stock Exchange, CRDB Bank and NMB Bank market capitalisation data
- USD 2.7 billion each
- Verify against DSE most recent market data before publication
- Available at dse.co.tz
- Nairobi Securities Exchange, Kenya listed company market capitalisation data
- Available at nse.co.ke
- Uganda Securities Exchange, MTN Uganda market capitalisation data
- Available at use.or.ug
- Harvard Growth Lab, Economic Complexity Index
- Productive complexity and corporate landscape analysis
- Available at growthlab.hks.harvard.edu
- Standard Chartered Bank, SGR financing announcement, 28 April 2026
- Tanzania infrastructure investment context
- Available at sc.com
- Tanzania Electric Supply Company, operational records
- Julius Nyerere Hydropower Project context
- Available at tanesco.co.tz
- Rwanda Development Board, regional corporate and investment data
- Available at rdb.rw
- Uganda Bureau of Statistics, MTN Uganda and telecoms sector data
- Available at ubos.org
- Kenya National Bureau of Statistics, banking and corporate sector data
- Available at knbs.or.ke
- DRC Institut National de la Statistique, regional corporate landscape comparative data
- Available at ins-rdc.org
Uchumi360 covers business, investment, and economic policy across East, Central, and Southern Africa.
For the serious reader
You read to the end. That places you in a small group.
Uchumi360 is built for readers who demand precision over speed, structure over sentiment, and analysis that holds uncomfortable conclusions rather than softening them. If this work sharpens how you think about Africa's economy, help us keep building the infrastructure behind it.
Institutional Partners
Commission intelligence. Shape the conversation.
Uchumi360 works with development finance institutions, investment firms, sovereign bodies, and strategic organisations across the coverage region. Institutional partnership unlocks:
- Commissioned sector and country intelligence reports
- Branded research series under your institution's authority
- Exclusive data briefings for internal strategy teams
- Speaking and editorial presence at Uchumi360 events
- Co-published investment outlooks for your markets
Support Our Work
Independent analysis has a cost. Help us bear it.
Uchumi360 does not carry advertising. It does not take editorial direction from sponsors. Every article is produced without commercial compromise. Your contribution funds the reporting, research, and editorial infrastructure that keeps this analysis free from influence.
Secure checkout: One-time and monthly support are processed securely. Add payment credentials to enable checkout here.
Stay Connected
Keep up with every new insight.
Follow our latest analysis, policy coverage, and market intelligence as soon as it is published. If you need something specific, reach out directly and we will point you to the right research.
