
Tanzania Leads Africa in Japanese Used Car Imports. Here's The Continent's Top 10

Ready
Tanzania has become Africa's largest destination for used vehicles exported from Japan, taking in an estimated 110,000–117,000 units in 2025, roughly 50% more than second-placed Kenya. The volume is large enough to rank Tanzania among Japan's top three used-car destinations worldwide, behind only the UAE and Russia. The real driver isn't Tanzanian demand alone: the Port of Dar es Salaam serves as the entry point for Zambia, Malawi, Burundi, Rwanda and parts of the DRC, meaning Tanzania captures import volume that regional neighbours never see land on their own shores. The harder question is what Tanzania does with that position; it remains overwhelmingly a vehicle consumption and transit market rather than a manufacturing one, even as Chinese automakers begin building assembly capacity elsewhere on the continent.
Tanzania has become the biggest destination in Africa for used vehicles exported from Japan, ahead of Kenya, ahead of South Africa, ahead of every other market on the continent. On confirmed 2024 data, it's not close, and the gap has almost certainly widened since.
Africa's top 10 destinations for Japanese used vehicles
Japan's Ministry of Finance publishes confirmed annual used-vehicle export totals by destination. Data compiled from that source (via JapanStat) puts Tanzania's 2024 total at exactly 77,992 units and Kenya's at 63,236, both directly confirmed, not estimated. Industry reporting citing continued strong 2025 and 2026 growth puts Tanzania's 2025 volume at roughly 110,000 to 117,000 and Kenya's at roughly 77,000, though these more recent figures rest on reported growth rates rather than a second confirmed Ministry of Finance annual total. The rest of the table is built from monthly 2025 shipment snapshots extrapolated to a full year, which is weaker evidence. Treat rankings below third place as directional, not precise.

Tanzania and Kenya's positions at the top now rest on genuinely confirmed data, not estimates. The 2025 figures for both are consistent with the confirmed 2024 baseline plus the growth rates reported by industry trackers. Tanzania's implied 2025 growth of roughly 41 to 50%, and Kenya's of roughly 22%, are large but not implausible given documented momentum: Japan's own export data shows Tanzania alone absorbing 74,486 vehicles in just the first five months of 2026, an annualised pace well above even the higher 2025 estimate.
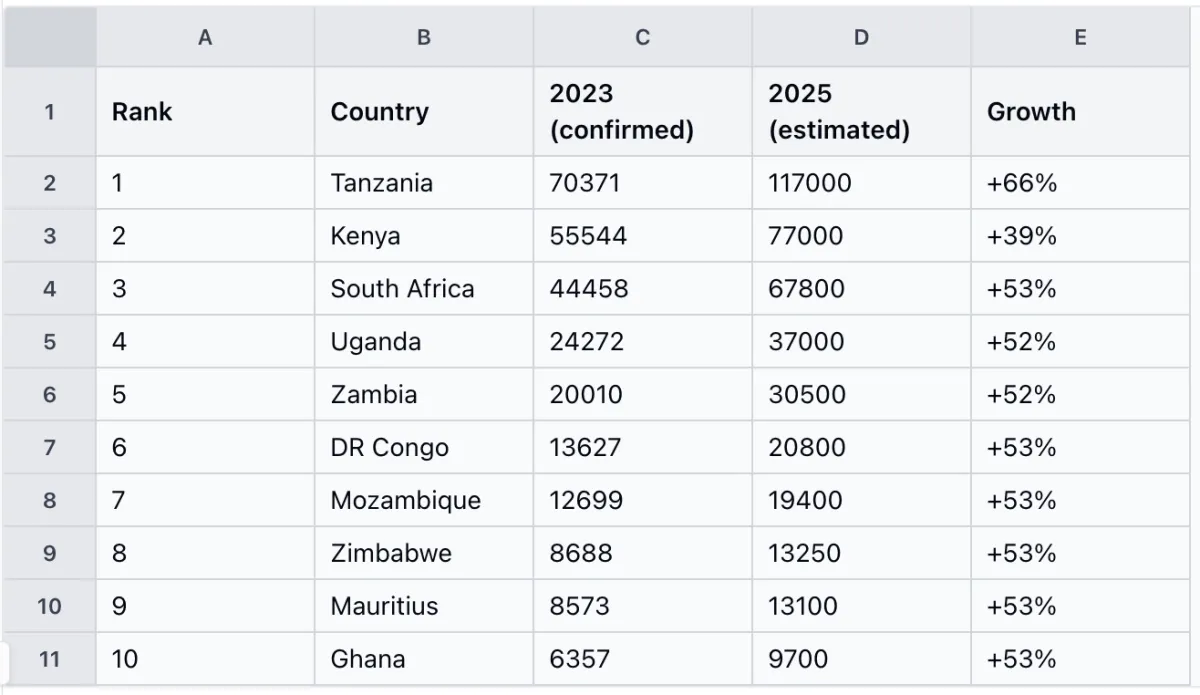 Africa's used car market data, showing it is not going to slow down any time soon
Where Tanzania actually ranks globally
Globally, the confirmed 2024 ranking was: UAE (226,762), Russia (199,098), Mongolia (111,661), New Zealand (80,000), then Tanzania (77,992). That's fifth place, not third. Tanzania's continued fast growth into 2025 and 2026, against a UAE market that has since fallen sharply (down roughly 65% year-on-year by mid-2026 as demand rerouted toward East Africa), makes it plausible that Tanzania has since overtaken Mongolia and New Zealand to reach third globally, the claim made in earlier reporting on this trade.
Japan's used-vehicle exports by destination, 2024 (Japan Ministry of Finance)
| Rank | Country | Units |
| 1 | UAE | 226,762 |
| 2 | Russia | 199,098 |
| 3 | Mongolia | 111,661 |
| 4 | New Zealand | 80,000 |
| 5 | Tanzania | 77,992 |
| 6 | Kenya | 63,236 |
| 7 | Pakistan | 39,961 |
| 8 | Malaysia | 38,616 |
| 9 | Bangladesh | 36,226 |
| 10 | Singapore | 9,245 |
| 11 | Hong Kong | 8,513 |
Japan's vehicle export value by African destination, 2024 (UN Comtrade)
| Country | Value |
| Zambia | $479.8 million |
| Uganda | $461.1 million |
| Tanzania | $335.1 million |
| Nigeria | $162.49 million |
| Mozambique | $55.15 million |
| Ghana | $49.77 million |
But that specific ranking for a completed 2025 calendar year hasn't been directly confirmed by a published Ministry of Finance annual total, so it should be read as a reasonable inference from the trend rather than a settled fact.
Why Tanzania, specifically
The obvious answer, that Tanzanians simply like Japanese cars, is true but incomplete. The more important answer is geography. The Port of Dar es Salaam handles the overwhelming majority of Tanzania's international trade and doubles as the maritime gateway for several landlocked neighbours: Zambia, Malawi, Burundi, Rwanda and parts of the Democratic Republic of Congo all move significant cargo, including vehicles, through it. Uganda's presence in the top five, despite having no coastline at all, makes the same point from the other direction: its Japanese vehicles arrive via regional corridors running through Mombasa and Dar es Salaam.
That means a meaningful share of the vehicles counted in Tanzania's import statistics aren't ending their journey in Tanzania. Some are in transit, destined for resale or registration in a neighbouring market. Industry reporting on Japan's vehicle trade has explicitly noted this pattern, cautioning that not every vehicle shipped to Tanzania is ultimately sold to a Tanzanian buyer; some of the volume reflects transit demand and regional redistribution through the port rather than pure domestic consumption.
South Africa's position on the list needs a similar caveat in the opposite direction: it has a developed domestic vehicle manufacturing industry and restricts used-vehicle imports for local registration far more tightly than Tanzania or Kenya do. Much of what arrives in South African ports under this trade is destined for regional transit and re-export, not South African driveways.
A second dataset that complicates the picture, usefully
Unit counts aren't the only way to measure this trade, and a second, independent data source tells a genuinely different story worth sitting with rather than smoothing over. UN Comtrade, official trade statistics reported directly by governments rather than compiled from shipment tallies, records the total value of vehicles Japan exported to each country in 2024. By that measure, Tanzania received US$335.1 million in vehicles from Japan. Uganda received US$461.1 million. Zambia received US$479.8 million, both higher than Tanzania, despite each importing a fraction of Tanzania's estimated unit count.
That's not a contradiction so much as a different lens on the same trade. Comtrade's "vehicles" category captures everything Japan ships, including new trucks, buses and machinery alongside used passenger cars, while the unit-count figures above track used vehicles specifically. Uganda's Comtrade breakdown shows US$253.7 million of its total in "motor cars and vehicles for transporting persons" alone, alongside meaningful goods-vehicle and bus values; Zambia's breakdown shows a similar split toward higher-value categories. The likely explanation: Tanzania's volume leans toward high-quantity, comparatively low-value-per-unit used passenger cars, a real share of which are moving onward through the port rather than staying in-country, while Uganda and Zambia are importing fewer vehicles but a pricier mix, commercial trucks and newer stock geared to specific sectors like mining and freight, arriving on their own account rather than via a neighbour's port statistics.
This is a genuine complication for the "Tanzania captures value other countries can't" argument made below, and it's worth stating plainly: on trade value, Uganda and Zambia are not junior partners in this relationship. They're substantial vehicle-import markets in their own right, just with a different vehicle mix and, in Zambia's case, likely more direct Japan-to-Zambia trade than the used-passenger-car unit count alone would suggest.
The corridor is the business, not just the car
Line up the top 10 and a pattern emerges quickly: almost every major destination sits on, or depends on, one of a handful of ports. Tanzania has Dar es Salaam. Kenya has Mombasa. South Africa has Durban. Mozambique has Maputo and Beira. Landlocked Uganda, Zambia and Zimbabwe depend entirely on gateways belonging to someone else.
That makes this fundamentally a port-and-corridor story before it's an automotive one. Whoever controls the gateway captures value well beyond the sale price of the vehicle itself: customs clearance, storage, inland transport, insurance, financing, inspection, repair and spare parts, much of it generated by a customer who may live a thousand kilometres from the port and never sets foot in Tanzania. Dar es Salaam's advantage, in other words, is bigger than Tanzania's own car market, and the services economy that can be built around that transit volume (vehicle inspection, parts distribution, fleet management, logistics, auctions) is arguably a bigger opportunity than the import trade itself.
The uncomfortable policy question underneath the numbers
Here's where Tanzania's leading position gets less flattering. More than 100,000 Japanese vehicles are entering the country every year, and Tanzania remains far more significant as a place vehicles are consumed and redistributed than a place they're made. The market has clearly proven itself; demand isn't the constraint. Industrial capacity is.
Simply taxing or restricting used imports more heavily wouldn't fix that on its own. It would mostly make transport more expensive for ordinary Tanzanians without automatically producing a competitive local assembly industry to replace the imports. The more useful question for policymakers is what it would actually take to make an investor choose to assemble or manufacture a vehicle in Tanzania rather than simply ship a finished used one from Japan, which comes down to reliable and competitively priced electricity, predictable tax and regulatory settings, a local component-supplier base, technical skills, financing, and access to the wider East African market via existing regional trade arrangements. Tanzania already has the one ingredient none of that works without: proven, large-scale demand.
Elsewhere on the continent, that shift is already starting
The timing is relevant because a first mover has just appeared next door in the region, if not next door geographically. Chery, China's largest vehicle exporter, agreed in January 2026 to acquire Nissan's Rosslyn manufacturing plant near Pretoria, South Africa, a facility with existing capacity to build around 45,000 vehicles a year. The deal is expected to close by mid-2026, with Chery targeting production of plug-in hybrids, battery-electric vehicles and models under its Jetour brand at the site from late 2027, positioning South Africa as what the company describes as its African manufacturing, R&D and export hub.
It's one data point, not a trend yet, but it's a concrete signal that Chinese automakers are starting to view African vehicle manufacturing capacity as worth acquiring rather than only exporting into. Analysts tracking the shift point to South Africa, Morocco, Kenya, Ethiopia and Ghana as the markets best positioned to attract similar investment, largely on the strength of existing industrial capacity and supportive policy. Tanzania's name isn't yet on that list, which, given its position at the top of the import table, is either a gap or an opportunity depending on what policy does next.
What's confirmed, what's estimated, and what's still open
Tanzania and Kenya's 2024 figures are now genuinely confirmed against Japan's Ministry of Finance export data, as solid as third-party trade data gets. Their 2025 figures are a step down in certainty: real, reported growth rates applied to a confirmed base, not a second confirmed annual total. The rest of the top 10, South Africa through Mozambique, are built from single-month 2025 shipment figures extrapolated to a full year, which is a reasonable approximation but should not be read as precise; several of those countries' relative rankings could plausibly shift with better data. The claim that Tanzania ranks third globally is a reasonable inference from a confirmed fifth-place finish in 2024 plus strong subsequent growth, not a confirmed 2025 result. The value-based Comtrade figures for Tanzania, Uganda, Zambia, Nigeria and Ghana are official government-reported trade statistics and among the most solid numbers in this piece, though they measure total vehicle trade value rather than used-vehicle units, so they answer a different question than the main ranking table. The continental total (roughly 570,000 vehicles shipped from Japan to Africa in 2025) is cited from Japanese trade reporting but wasn't independently cross-verified against a second source for this piece.
FAQ
Which African country imports the most used cars from Japan? Tanzania, confirmed. Japan's Ministry of Finance recorded 77,992 used vehicles to Tanzania in 2024, well ahead of Kenya's 63,236, and industry data points to Tanzania growing further in 2025 and 2026.
Why does Tanzania import so many more vehicles than its population would suggest? Because the Port of Dar es Salaam serves as the maritime gateway for several landlocked neighbours, including Zambia, Malawi, Burundi, Rwanda and parts of the DRC, so a share of Tanzania's recorded imports are in transit to other countries, not sold to Tanzanian buyers.
Do Uganda and Zambia actually import more vehicles than the unit rankings suggest? In value terms, yes. UN Comtrade data shows both countries received more total vehicle trade value from Japan in 2024 than Tanzania did, despite far lower used-vehicle unit counts, likely reflecting a pricier mix of trucks, buses and newer vehicles rather than high-volume used passenger cars.
Does Tanzania manufacture vehicles? Not at meaningful scale. Despite leading Africa in import volume, Tanzania remains a consumption and distribution market rather than a manufacturing one, in contrast to South Africa, which has an established domestic auto industry and has just attracted a major new Chinese manufacturing investment.
Is Chinese investment starting to shift Africa's auto industry from imports to manufacturing? It's an early signal rather than an established trend. Chery's acquisition of Nissan's Rosslyn plant in South Africa, targeting production from late 2027, is the clearest current example.
Sources: Japan Ministry of Finance export statistics as compiled by JapanStat; UN Comtrade international trade database (via Trading Economics); Japan External Trade Organization (JETRO) trade statistics reporting; Japan Used Motor Vehicle Exporters Association (JUMVEA)-linked industry reporting; Japan-Carrier and japanesecartrade.com monthly export trend analysis; ProvideCars 2026 export trend analysis; TokyoCarZ; Reuters/Nissan Motor statements on the Rosslyn plant sale; AP News, ITWeb and Ecofin Agency reporting on the Chery-Nissan Rosslyn deal.
Visual opportunities: a bar chart of the top 10 African destinations with confidence shading; a dual chart contrasting the unit-based ranking (Tanzania first) against the Comtrade value-based ranking (Uganda and Zambia ahead of Tanzania); a simple map of East and Southern Africa showing Dar es Salaam, Mombasa and Durban with corridor lines to landlocked destination countries; a before-and-after graphic contrasting "vehicle import hub" and "vehicle manufacturing hub" positioning for Tanzania versus South Africa.
 Uchumi360
Business Intelligence
Uchumi360
Business Intelligence
- Japan External Trade Organization (JETRO) trade statistics reporting
- JapanStat (Japan Ministry of Finance export data)
- Japan Used Motor Vehicle Exporters Association (JUMVEA)-linked industry reporting
- Japan-Carrier monthly export trend analysis
- TokyoCarZ
- Soukyo used-vehicle export guidance
- Reuters/Nissan Motor statements on the Rosslyn plant sale
- AP News, ITWeb and Ecofin Agency reporting on the Chery–Nissan Rosslyn deal
Uchumi360 covers business, investment, and economic policy across East, Central, and Southern Africa.
For the serious reader
You read to the end. That places you in a small group.
Uchumi360 is built for readers who demand precision over speed, structure over sentiment, and analysis that holds uncomfortable conclusions rather than softening them. If this work sharpens how you think about Africa's economy, help us keep building the infrastructure behind it.
Institutional Partners
Commission intelligence. Shape the conversation.
Uchumi360 works with development finance institutions, investment firms, sovereign bodies, and strategic organisations across the coverage region. Institutional partnership unlocks:
- Commissioned sector and country intelligence reports
- Branded research series under your institution's authority
- Exclusive data briefings for internal strategy teams
- Speaking and editorial presence at Uchumi360 events
- Co-published investment outlooks for your markets
Support Our Work
Independent analysis has a cost. Help us bear it.
Uchumi360 does not carry advertising. It does not take editorial direction from sponsors. Every article is produced without commercial compromise. Your contribution funds the reporting, research, and editorial infrastructure that keeps this analysis free from influence.
Secure checkout: One-time and monthly support are processed securely. Add payment credentials to enable checkout here.
Stay Connected
Keep up with every new insight.
Follow our latest analysis, policy coverage, and market intelligence as soon as it is published. If you need something specific, reach out directly and we will point you to the right research.
