
Tanzania Outpaces Kenya But Trails Rwanda. Comparing East Africa's Economic Performance
Ready
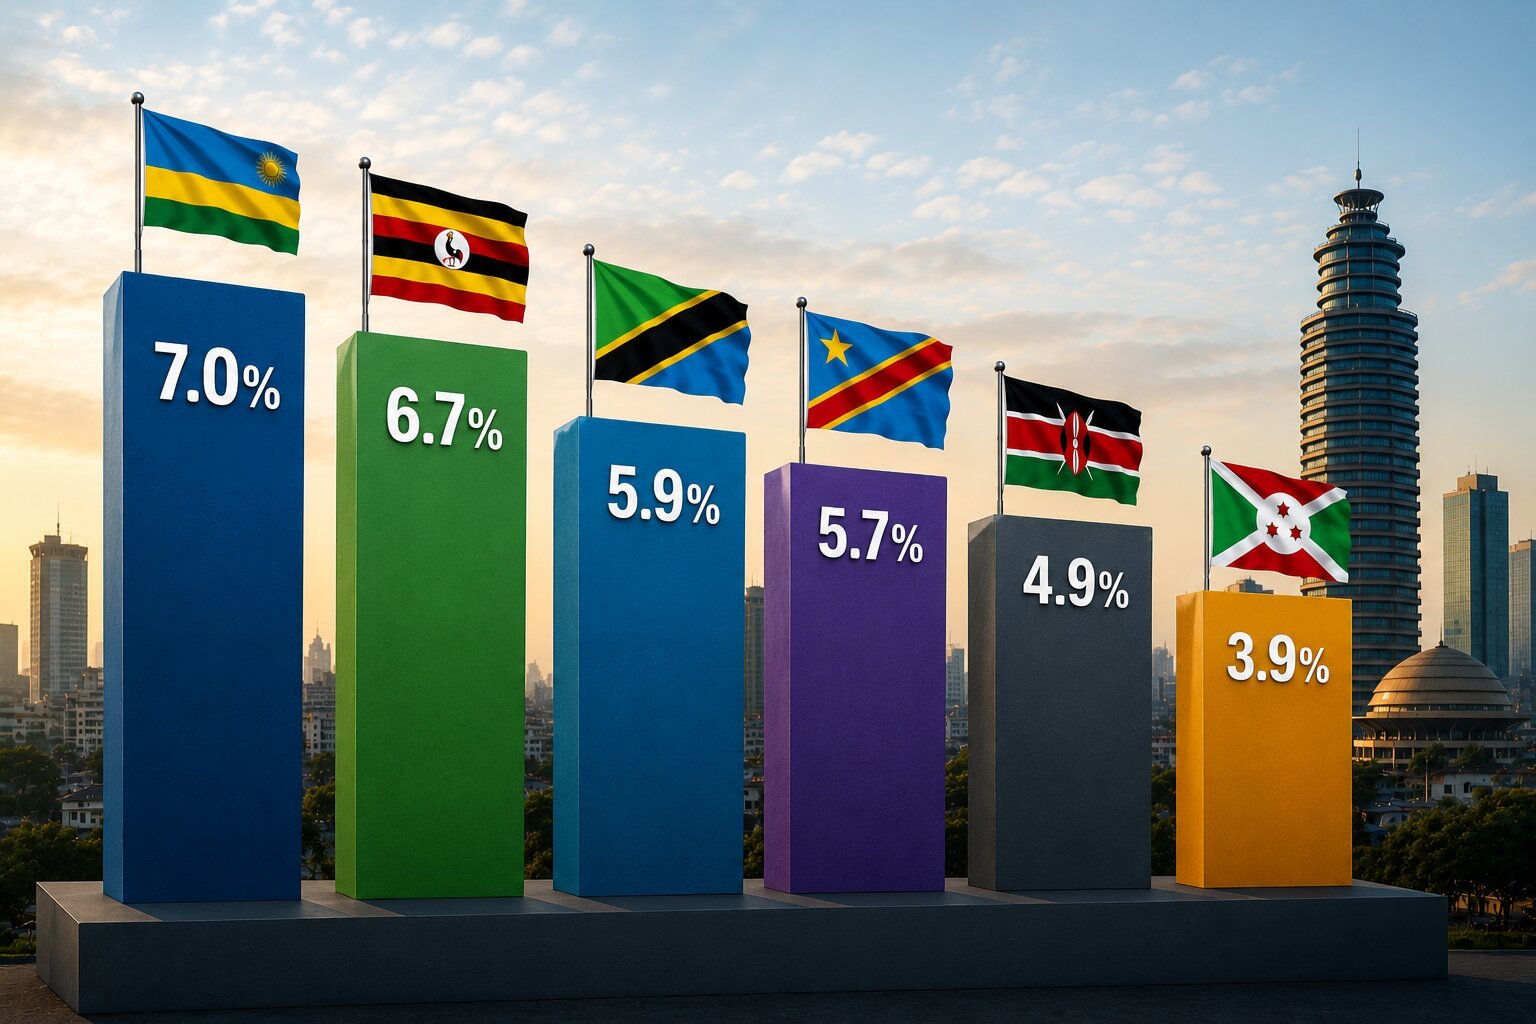
EAC GDP growth 2025 confirmed in National Development Plan 2026/27: Rwanda 7.0 percent, Uganda 6.7 percent, Tanzania 5.9 percent, Kenya 4.9 percent, DRC 5.7 percent, Burundi 3.9 percent. EAC average 10.4 percent distorted by South Sudan 46.1 percent rebound from minus 26.1 percent in 2024. 2026 EAC average projected at 5.2 percent and 5.3 percent in 2027. Tanzania inflation 3.3 percent second lowest after Uganda 3.6 percent, against Rwanda 7.0 percent, Kenya 4.5 percent, Burundi 34.2 percent. Tanzania foreign reserves 4.9 months import cover, above EAC 4.5-month criterion and Tanzania's own 4-month minimum. Tanzania FY2026/27 GDP target 6.3 percent would exceed projected Rwanda 2026 growth of 7.0 percent at 2025 rates if Rwanda decelerates, and would continue to exceed Kenya's projected 4.9 percent. Tanzania mining USD 5,401.9 million exports versus Kenya's flower and horticulture dominance. Tanzania SGR competing with Kenya's Northern Corridor for Central African transit cargo. Tanzania's 5.9 percent growth is the result of a consistent policy framework applied consistently. Rwanda's 7.0 percent is a governance and investment attraction story. Uganda's 6.7 percent is partly a pre-oil-production construction story. Each trajectory has different sustainability characteristics over the 2026 to 2030 medium term.
DAR ES SALAAM — Tanzania grew 5.9 percent in 2025 according to National Bureau of Statistics data cited in the National Development Plan 2026/27, placing it third among the six core EAC member economies ranked by growth rate. Rwanda led at 7.0 percent, Uganda at 6.7 percent, then Tanzania at 5.9 percent, DRC at 5.7 percent, Kenya at 4.9 percent, and Burundi at 3.9 percent.
Why Rwanda is growing faster
Rwanda's 7.0 percent growth, sustained across multiple years and confirmed by National Institute of Statistics Rwanda data, reflects the combination of high governance quality, concentrated tourism revenue from gorilla trekking and MICE events, fintech and financial services sector development through the KIFC, and construction and services activity associated with the Kigali urban development programme. Rwanda's growth is not resource-driven: it has no significant mineral exports, no coastal port, and a population of only 14 million that limits its domestic market. It is governance and investment environment-driven, which makes it both more consistent across years and more sensitive to political stability than Tanzania's more diversified growth model.
Rwanda's 2026 growth projection from IMF data is 7.2 percent, modestly above 2025. Tanzania's 6.3 percent target for 2026 would narrow the gap but not eliminate it.
Why Uganda is growing faster
Uganda's 6.7 percent in 2025 reflects in part the EACOP construction activity whose 82.6 percent completion by April 2026 has been generating logistics, construction, professional services, and supply chain activity across Uganda's oil-producing western regions. Once EACOP is complete and oil production begins, Uganda's growth profile will shift from construction-driven to resource-driven, with the volatility characteristics that commodity cycles introduce. The growth rate is partly a construction boom borrowed from the future in which oil revenues must service the infrastructure debt.
Why Kenya is growing more slowly
Kenya's 4.9 percent growth in 2025, below Tanzania for the first time in the five-year series, reflects the fiscal consolidation that followed the 2024 debt crisis, the social disruption from the June 2024 protests that disrupted economic activity, and the tourism and investment climate uncertainty that the political environment created. Kenya's longer-term growth potential remains strong, but 2024 and 2025 were disrupted years whose GDP growth understates the underlying structural capacity.
The comparative advantages Tanzania holds
Tanzania's structural advantages over all EAC peers include its coastal position and Central Corridor logistics function, which generate transit revenue from every tonne of cargo the landlocked neighbours route through Dar es Salaam. Its mineral resource diversity across gold, graphite, nickel, rare earth, coal, uranium, and natural gas is unmatched in the region. Its domestic market at 70 million people growing to 118 million by 2050 provides demand-side investment justification that Rwanda's 14 million and Uganda's 50 million cannot match for most manufacturing investments. And its food surplus position at 130 percent self-sufficiency insulates it from the food price inflation and import dependence that creates macroeconomic vulnerability in Kenya, Rwanda, and especially Burundi.
 Uchumi360
Business Intelligence
Uchumi360
Business Intelligence
Uchumi360 covers business, investment, and economic policy across East, Central, and Southern Africa.
For the serious reader
You read to the end. That places you in a small group.
Uchumi360 is built for readers who demand precision over speed, structure over sentiment, and analysis that holds uncomfortable conclusions rather than softening them. If this work sharpens how you think about Africa's economy, help us keep building the infrastructure behind it.
Institutional Partners
Commission intelligence. Shape the conversation.
Uchumi360 works with development finance institutions, investment firms, sovereign bodies, and strategic organisations across the coverage region. Institutional partnership unlocks:
- Commissioned sector and country intelligence reports
- Branded research series under your institution's authority
- Exclusive data briefings for internal strategy teams
- Speaking and editorial presence at Uchumi360 events
- Co-published investment outlooks for your markets
Support Our Work
Independent analysis has a cost. Help us bear it.
Uchumi360 does not carry advertising. It does not take editorial direction from sponsors. Every article is produced without commercial compromise. Your contribution funds the reporting, research, and editorial infrastructure that keeps this analysis free from influence.
Secure checkout: One-time and monthly support are processed securely. Add payment credentials to enable checkout here.
Stay Connected
Keep up with every new insight.
Follow our latest analysis, policy coverage, and market intelligence as soon as it is published. If you need something specific, reach out directly and we will point you to the right research.
