
Six Countries Moved Up the World Bank's Income Ladder in 2026. None Were African. Here Is What the New Map Reveals About the Continent's Development Gap.
Ready
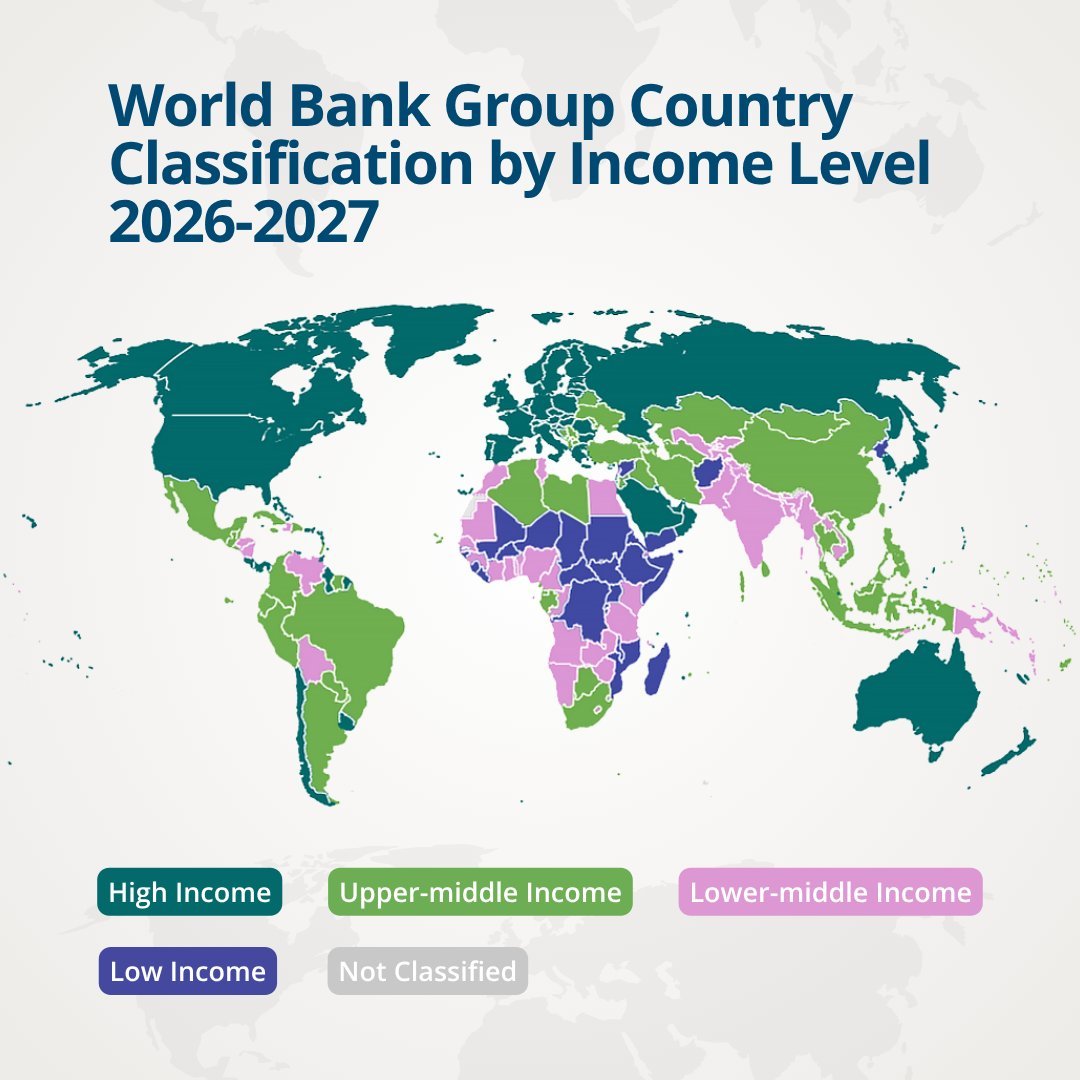
The World Bank's 2026/27 income classifications confirm that six countries graduated to higher categories, none from Sub-Saharan Africa. The thresholds are: low income below USD 1,175 GNI per capita, lower middle income USD 1,176 to USD 4,635, upper middle income USD 4,636 to USD 14,375, and high income above USD 14,375. Botswana, Mauritius, South Africa, Gabon, Equatorial Guinea, and Cabo Verde sit in upper middle income. Seychelles is Sub-Saharan Africa's only high income economy. Vietnam's graduation to upper middle income came through export-oriented manufacturing and global value chain integration, not resource extraction. That is the model East Africa's economies need to study.
Every July, the World Bank redraws one of development economics' most influential maps. Countries are reassigned into four income categories based on Gross National Income per capita, calculated using the Atlas methodology, which smooths short-term exchange rate volatility to provide a stable international comparison. The 2026/27 update contains an encouraging headline: six economies moved into higher income categories and none moved backwards.
The six are Jordan, Micronesia, the Philippines, Sri Lanka, Vietnam, and Togo. Vietnam and the Philippines graduated from lower middle to upper middle income. Togo moved from low income to lower middle income. The others followed different paths, including Sri Lanka's recovery from a severe economic crisis and the Philippines' combination of demographic change and broad-based expansion.
No Sub-Saharan African economy moved upward. That is not a failure headline. It is a structural observation that deserves the serious analytical attention it rarely receives.
What the classification actually measures
The most common misconception is that World Bank income categories measure the size of an economy. They do not. GNI per capita measures the average income generated by a country's residents, adjusted for income earned both domestically and abroad, then converted to US dollars through the Atlas method. For 2026/27, the thresholds are:
Low income: GNI per capita of USD 1,175 or below. Lower middle income: USD 1,176 to USD 4,635. Upper middle income: USD 4,636 to USD 14,375. High income: above USD 14,375, according to World Bank classification documentation.
These categories say nothing about income inequality, industrial sophistication, or institutional quality. A country can cross into a higher bracket while still facing deep structural challenges. A lower middle income economy can simultaneously have stronger manufacturing capability than a resource-dependent upper middle income one. The classification is a per capita income measure, not a development quality assessment.
Where Africa stands
Africa's long-run trajectory is positive. When the World Bank introduced modern income classifications in the late 1980s, roughly 30 percent of economies globally were classified as low income, according to World Bank blog data. Today that figure is approximately 11 percent. African economies have contributed to that shift.
Botswana, Mauritius, South Africa, Gabon, Equatorial Guinea, and Cabo Verde are currently in the upper middle income category. Seychelles is Sub-Saharan Africa's only high income economy under the current classification. These are real achievements.
But they are concentrated in a small number of economies, some of which reached their classifications through natural resource dependence rather than broad-based productivity growth. The larger pattern is that much of Sub-Saharan Africa remains in the low income and lower middle income categories despite years of growth, and the gap between recorded GDP growth and income per capita gains is the central development challenge the classifications make visible.
Why growth has not translated into income category advancement for most of Africa
East Africa's economies illustrate the problem precisely. Tanzania, Kenya, Uganda, and Rwanda have all recorded sustained GDP growth over the past decade. Infrastructure investment has accelerated. Digital adoption has expanded. Regional integration has deepened. None has crossed into upper middle income status.
The explanation is the gap between economic expansion and structural transformation. Much of Africa's growth over the past two decades has been driven by commodities, construction, telecommunications, and services. Those sectors raise output. They do not necessarily change how an economy produces its output, which is the mechanism that lifts income per capita fast enough to move countries across income thresholds.
Manufacturing remains a relatively small share of GDP across most of Sub-Saharan Africa. Labour productivity remains low. Exports remain concentrated in primary commodities. Industrial value addition remains limited. The result is that national income grows, but not quickly enough on a per capita basis to advance countries through the World Bank's classification brackets.
This is what economists mean by the distinction between growth and structural transformation. The first increases output. The second changes the productive structure that generates it.
Vietnam's upgrade is the most instructive case
Of the six countries that moved upward in 2026/27, Vietnam's graduation from lower middle to upper middle income is the most relevant precedent for East Africa, because Vietnam achieved it without significant natural resource wealth.
Vietnam's transition was built on decades of export-oriented manufacturing, deliberate integration into global value chains, and continuous improvement in manufacturing productivity. Electronics, textiles, and footwear replaced primary commodity exports as the engine of income growth. The strategy required sustained industrial policy, investment in technical education, and regulatory reform that made the country attractive to manufacturing investment over multiple decades.
That trajectory is directly transferable as a model, not as a template to copy identically but as evidence that the mechanism works. Countries that cannot discover oil can still advance through the income classifications if they manufacture more sophisticated products, integrate into global value chains, and raise the productivity of their workforce.
What East Africa's income classification ambitions require
Achieving upper middle income status requires East Africa's economies to generate significantly more value per worker than they currently do. The arithmetic is straightforward: the lower middle income ceiling is USD 4,635 GNI per capita. Moving through upper middle income toward high income requires sustained per capita income growth at rates that outpace population growth over decades, not years.
That means manufacturing capabilities need to deepen. Export baskets need to diversify toward higher-value products. Logistics systems need to support the speed and reliability that global value chain participation requires. Education systems need to produce the technical and professional workforce that industrial upgrading demands. Institutions need to provide the regulatory predictability and contract enforcement that long-horizon industrial investment requires.
Tanzania's Vision 2050 target of a USD 1 trillion economy and upper-middle-income status by 2050 is exactly this kind of income classification ambition expressed as national policy. The question is whether the structural transformation agenda, manufacturing expansion, agricultural value addition, services export growth, is moving at the pace the target requires.
The World Bank's classifications do not measure ambition. They measure outcomes. The 2026/27 map shows where East Africa currently stands. What it shows next year and the year after depends on decisions being made in finance ministries, industrial parks, and university faculties right now.
FAQ
What does the World Bank's income classification actually measure? GNI per capita, which is the average income generated by a country's residents both domestically and abroad, converted to US dollars using the Atlas method that smooths exchange rate volatility. It does not measure economic size, inequality, poverty depth, or industrial sophistication.
What are the 2026/27 income thresholds? Low income: USD 1,175 or below. Lower middle income: USD 1,176 to USD 4,635. Upper middle income: USD 4,636 to USD 14,375. High income: above USD 14,375.
Which African countries are in the upper middle income category? Botswana, Mauritius, South Africa, Gabon, Equatorial Guinea, and Cabo Verde. Seychelles is Sub-Saharan Africa's only high income economy under the current classification.
Why has East Africa's economic growth not translated into higher income classifications? Because much of the growth has been driven by commodities, construction, and services rather than manufacturing and industrial value addition. GNI per capita grows when productivity rises across the economy, not just when aggregate output expands. Population growth also means per capita income improvements require GDP growth rates that consistently exceed demographic expansion.
What does Vietnam's 2026 graduation to upper middle income teach East Africa? That resource wealth is not the mechanism. Vietnam graduated through export-oriented manufacturing, global value chain integration, and sustained productivity improvement over decades. It is a demonstration that lower middle income economies can cross into upper middle income through industrial policy and productivity growth rather than commodity discovery.
 Uchumi360
Business Intelligence
Uchumi360
Business Intelligence
Uchumi360 covers business, investment, and economic policy across East, Central, and Southern Africa.
For the serious reader
You read to the end. That places you in a small group.
Uchumi360 is built for readers who demand precision over speed, structure over sentiment, and analysis that holds uncomfortable conclusions rather than softening them. If this work sharpens how you think about Africa's economy, help us keep building the infrastructure behind it.
Institutional Partners
Commission intelligence. Shape the conversation.
Uchumi360 works with development finance institutions, investment firms, sovereign bodies, and strategic organisations across the coverage region. Institutional partnership unlocks:
- Commissioned sector and country intelligence reports
- Branded research series under your institution's authority
- Exclusive data briefings for internal strategy teams
- Speaking and editorial presence at Uchumi360 events
- Co-published investment outlooks for your markets
Support Our Work
Independent analysis has a cost. Help us bear it.
Uchumi360 does not carry advertising. It does not take editorial direction from sponsors. Every article is produced without commercial compromise. Your contribution funds the reporting, research, and editorial infrastructure that keeps this analysis free from influence.
Secure checkout: One-time and monthly support are processed securely. Add payment credentials to enable checkout here.
Stay Connected
Keep up with every new insight.
Follow our latest analysis, policy coverage, and market intelligence as soon as it is published. If you need something specific, reach out directly and we will point you to the right research.
