
Africa Is Installing 17 GW of Solar in 2026. Governments Can Barely See It
Ready
Africa is estimated to install a record 17 GW of solar in 2026, but three quarters of recent growth may be distributed systems that governments barely measure. Ember’s new report suggests businesses and households are reshaping Africa’s electricity system faster than official planning can see.
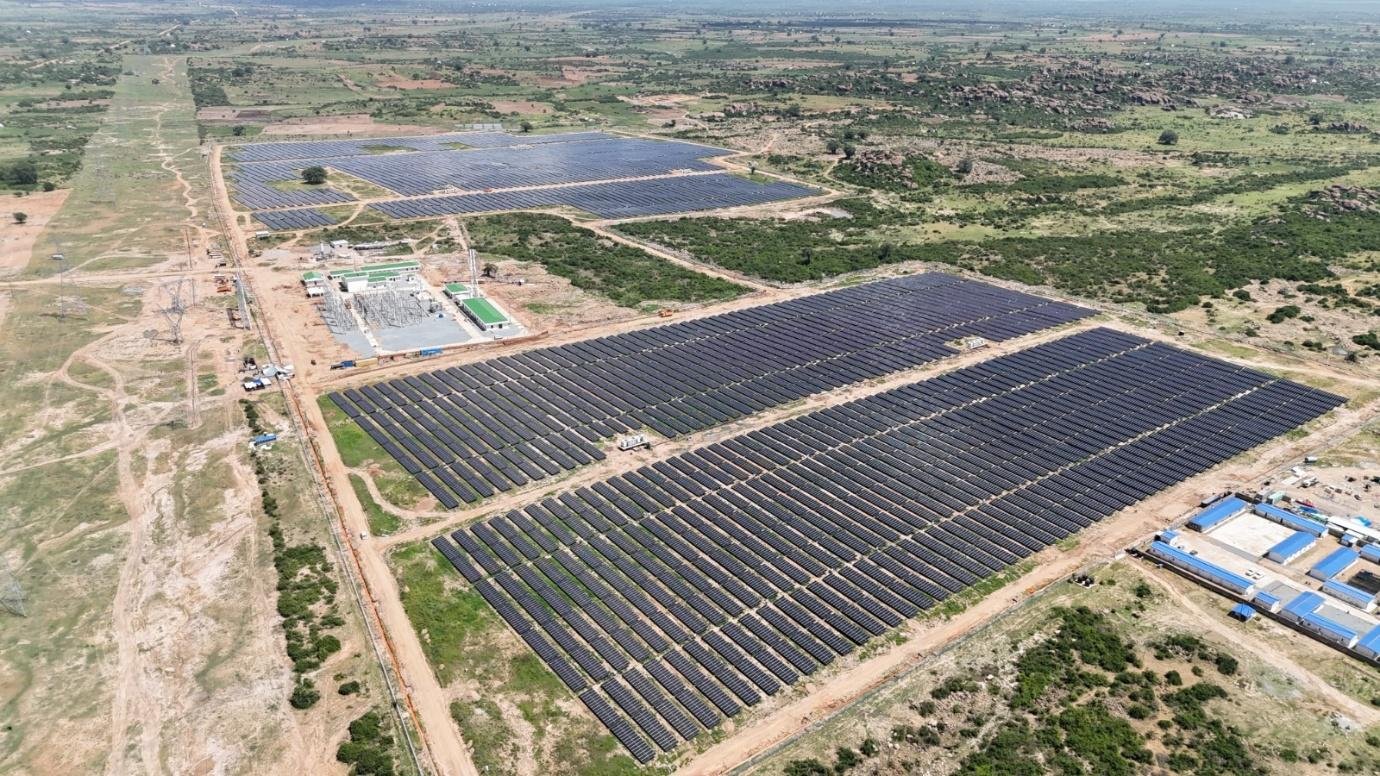
Africa’s solar market appears to have crossed into a different stage of development, but much of the expansion is happening outside the part of the electricity system that governments traditionally plan, procure and measure. A new report by Ember and the African Tech Futures Lab estimates that the continent will install 17 GW of solar capacity in 2026, 45% more than in 2025 and enough to make this the third consecutive record year. That is equivalent to roughly 47 MW, or about 100,000 solar panels, being installed every day. The more consequential finding is where that capacity is appearing. Ember estimates that about three quarters of Africa’s solar growth between 2023 and 2025 came from distributed systems, mostly customer side installations on businesses and rooftops that are barely visible in official statistics. Africa’s solar transition is therefore accelerating from below, financed substantially by households and companies responding to electricity prices, unreliable supply and falling technology costs rather than waiting for governments to build large power stations.
The finding changes the way Africa’s electricity transition should be understood. The traditional model assumes that governments and utilities forecast demand, procure generating capacity, build transmission networks and then distribute power to consumers. Distributed solar reverses much of that sequence. Businesses experiencing expensive or unreliable electricity are buying generation for themselves, often before national planners have incorporated those systems into forecasts. Consumers are simultaneously becoming producers, batteries are beginning to replace diesel generators and electricity demand is increasingly being served behind the meter rather than entirely through national grids. The continent may consequently be adding electricity supply much faster than official power statistics suggest, but policymakers are making investment decisions using datasets that increasingly describe only part of the system.
How Much Solar Is Africa Actually Installing in 2026?
Ember estimates that Africa will install 17 GW of solar during 2026, representing a 45% increase from the previous year after growth of 51% in 2025 and 25% in 2024. The estimate is derived principally from Chinese customs data rather than national electricity statistics because China supplies almost all solar panels installed on the continent. Chinese exports of solar panels to Africa reached 23 GW in the twelve months to June 2026, up 53% from the previous twelve months and approximately equal to Chinese exports to the Middle East over the same period.
The methodology needs to be understood before treating 17 GW as a measured installation figure. Ember studied markets with stronger installation statistics and substantial reliance on Chinese panels and found that, historically, about 73% of reported Chinese solar exports had subsequently appeared as installed capacity, typically with around a six month delay. The organisation therefore applies that relationship, together with adjustments for non Chinese imports, re exports and domestic manufacturing, to estimate African installations. Ember itself notes considerable variation in the calibration sample, with installation ratios ranging roughly between 60% and 90%, so the African figures should be read as estimates rather than audited national capacity numbers.
Even with that qualification, the trade data point to a market expanding far faster than conventional statistics suggest. Thirty six of Africa’s 54 countries are expected to install record amounts of solar in 2026, while 19 are estimated to record annual growth exceeding 100%. The Democratic Republic of Congo leads the acceleration at 544%, followed by Zimbabwe at 282%, Egypt at 176% and Zambia at 117%. South Africa remains the continent’s largest annual market at an estimated 3.3 GW, but its share of African installations is expected to fall below 20% for the first time since 2019 as growth spreads across the continent. Egypt is projected to install 2 GW, Nigeria and the DRC 1.7 GW each, Algeria 1.4 GW and Morocco 1 GW.
Africa’s solar story is therefore no longer principally a South African story. Large markets are emerging in North, West and Central Africa, while several much smaller electricity systems are adding solar at a scale that can materially change their national power balances.
Why Are Official Solar Statistics Missing So Much Capacity?
Ember estimates that Africa added 12 GW of solar in 2025, almost twice the International Energy Agency estimate of 6.2 GW and more than two and a half times IRENA’s 4.6 GW figure. The report attributes much of that discrepancy to weak national reporting. Official national solar capacity information could be found for only 36 of 54 African countries, and only 14 had figures covering 2025. South Africa, Tunisia and Tanzania were the only countries identified as publishing some solar capacity information monthly or quarterly.
The statistical problem reflects the structure of the market. Large utility solar plants are easy to count because they generally pass through government procurement, licensing and grid connection processes. A 200 MW plant has a project company, a location, permits, financing and a defined connection point. Tens of thousands of rooftop systems installed by factories, shopping centres, hotels, farms and households are much harder to observe, particularly where registration rules are absent or rarely enforced.
Ember estimates that Africa installed about 26 GW of total solar between 2023 and 2025 but that only 5.9 GW can be accounted for by documented utility scale projects and around 0.2 GW by reported off grid systems. The remaining approximately 20 GW, or three quarters of the increase, is inferred to be distributed solar. Even in Egypt, where utility scale solar is substantial, Ember estimates that distributed systems account for 43% of recent solar growth.
This suggests that Africa’s energy transition is becoming statistically decentralised at the same time that it is becoming physically decentralised. National electricity statistics were designed around a power system in which relatively few large generators supplied a grid managed by a utility. Distributed solar creates millions of smaller electricity decisions that take place outside the traditional planning process.
Why Are African Businesses Installing Solar Without Waiting for Governments?
The report argues that Africa’s distributed solar boom has been driven primarily by economics rather than large subsidy programmes. Chinese manufacturing expanded rapidly, module prices fell to record lows and electricity reliability remained poor or electricity costs remained high in many African markets. Commercial and industrial users were therefore able to compare the cost of generating solar power on their own premises with the cost of purchasing unreliable grid electricity or running diesel generators.
Businesses are especially suited to solar because their electricity consumption tends to peak during daylight hours, when panels are producing power. Ember and the African Tech Futures Lab estimate that commercial and industrial customers account for at least 80% of distributed solar capacity in many African markets, with investment payback periods sometimes as short as two to five years. This is a very different market from rooftop solar in wealthier countries, where household adoption was often accelerated by subsidies, feed in tariffs or tax incentives. Much of Africa’s market has expanded because firms concluded that self generation was economically preferable to continuing dependence on existing electricity arrangements.
Different countries reached that conclusion through different pressures. South Africa removed restrictions on private generation during severe loadshedding and subsequently experienced around 7 GW of distributed capacity, including private wheeling arrangements. Zambia opened its market further after drought sharply reduced hydropower generation. Nigeria’s fuel subsidy removal and higher electricity tariffs strengthened the economics of solar for consumers able to finance the initial investment. Kenya, according to the report, did not require a comparable single policy trigger because high electricity costs and reliability concerns were already enough to stimulate private installations.
Africa’s solar boom can therefore be read partly as a vote by consumers on the economics of existing electricity systems. Businesses installing their own generation are increasing renewable capacity, but they are also revealing a willingness to spend private capital to avoid some combination of tariffs, outages, diesel costs and dependence on the grid.
Is Solar Beginning to Replace Diesel Generators in Africa?
The report identifies diesel displacement as one of the largest potential economic effects of distributed solar. Diesel generators remain deeply embedded in African electricity systems because unreliable grids force businesses, telecom companies, hotels, mines, farms and households to maintain backup generation. Ember cites earlier research showing that at least 17 African countries had more distributed diesel generator capacity than grid connected generation capacity.
The cost comparison is striking. Chinese solar panel exports to Africa during the twelve months to June 2026 cost approximately $2.4 billion. Ember calculates that producing the same amount of electricity using diesel generators at $1.40 per litre would require about $2.4 billion of diesel every three months. The comparison is explicitly hypothetical because not all new solar is replacing diesel and solar output requires other system components, particularly batteries where electricity is needed outside daylight hours. It nevertheless illustrates the difference between importing an asset that can produce electricity for decades and repeatedly importing fuel that is consumed once.
Battery imports strengthen the argument that this transition is already occurring. Africa has imported more dollars of batteries than solar panels from China since 2024, with battery export value quadrupling over two years while panel exports doubled. Nigeria and the DRC stand out, with batteries exceeding solar panel imports by a considerable margin. In Nigeria, the report links the trend to households and businesses replacing diesel generation during outages, while battery systems at DRC copper mines are increasingly being paired with solar to provide round the clock power.
The macroeconomic implications extend beyond electricity. Many African countries are net petroleum importers, so replacing diesel generation with domestically produced solar electricity reduces recurring foreign currency demand. Distributed solar may consequently affect current accounts and foreign exchange requirements even when the equipment itself is imported, because panels represent an upfront capital import while diesel represents a recurring fuel import.
Can New Solar Meet Africa’s Electricity Demand Growth?
The report estimates that the 17 GW installed in 2026 could produce around 23 TWh of electricity annually, assuming a conservative 15% capacity factor. That is equivalent to roughly 2.3% of Africa’s 2024 electricity generation, slightly above the continent’s average annual electricity demand growth of 2.2% between 2014 and 2024. On that arithmetic, one year of solar additions could theoretically produce enough incremental electricity to cover an average year of recent demand growth.
The impact is much larger in smaller electricity systems. Ember identifies ten countries where solar installed in 2026 alone could add electricity equivalent to more than 10% of existing annual grid generation. The estimate reaches 97% in Sierra Leone, 24% in Togo, 21% in Somalia and Djibouti, 14% in the DRC and Comoros, 12% in Namibia and Liberia, 11% in Chad and 10% in Lesotho. Together, these countries contain around 190 million people.
There is a second possibility that matters even more for development: solar may allow electricity consumption itself to grow faster. Africa’s electricity demand increased only 2.2% annually between 2014 and 2024, slower than the global average despite much lower electricity consumption per person. Low demand does not necessarily indicate low need. In many African economies, demand is constrained because supply is expensive, unreliable or unavailable.
The report points to Pakistan as a possible analogue. Distributed solar expanded rapidly enough there that electricity demand rose 21% between 2023 and 2025, with the increase supplied by new solar installations. Ember argues that cheaper and more reliable electricity allowed households and businesses to use electricity that grid conditions had previously suppressed.
If a similar pattern develops in Africa, solar would not merely meet existing demand growth. It could unlock electricity consumption that currently does not occur because power is too expensive or unreliable.
Why Is Invisible Solar a Problem for National Electricity Planning?
The rapid spread of distributed systems creates a planning problem because utilities and governments can make expensive mistakes if they do not know how much customer owned generation already exists. Distributed solar reduces demand observed by the grid during daylight hours. If planners interpret falling or slower grid demand as evidence that electricity needs are weak rather than recognising that customers are supplying themselves, future demand forecasts become distorted.
Ember notes that the African Union’s Continental Power Systems Masterplan forecasts only 23 GW of solar being installed across Africa by 2040, less than Ember’s estimate of 26 GW installed during 2023 to 2025 alone. If the report’s estimates are broadly correct, part of Africa’s long term electricity planning has already been overtaken by events.
The consequences extend into system operation. Grid operators need distributed solar data to forecast daytime demand, evening ramps, reserve requirements, local voltage, congestion and reverse power flows. Utilities also need the information to understand how customer self generation will affect electricity sales and tariff revenues. A power company planning future investments around an incomplete picture of behind the meter generation can procure unnecessary generation on one side of the system while failing to invest in batteries, distribution networks and balancing capacity on the other.
The problem is therefore not that distributed solar is competing with centralised electricity infrastructure. It is that distributed and centralised systems are increasingly becoming one electricity system while much of the planning framework still treats them as separate.
Could Distributed Solar Weaken African Utilities?
There is an uncomfortable economic trade off inside the solar boom. Businesses that leave part of the grid by generating their own electricity improve their own reliability and can reduce pressure on overloaded infrastructure, but they also reduce utility electricity sales. Many African tariff structures depend on industrial and commercial customers paying rates that help cross subsidise lower income households. When the most valuable customers increasingly self generate, utilities can lose revenue faster than their costs fall.
This can produce a difficult cycle. High electricity costs and poor reliability encourage commercial customers to install solar. Falling commercial demand weakens utility revenues. Financially weaker utilities struggle to improve networks. Service quality deteriorates or tariffs rise, making self generation even more attractive.
Ember also warns against romanticising distributed solar as automatically cheaper than a well functioning national system. The report estimates that forcing individual firms into self generation can cost two to four times as much as utility scale generation. Solar rooftops may still be rational for an individual company if the alternative is unreliable grid electricity or diesel, but an economy in which every factory has to build its own miniature power system is not necessarily the lowest cost foundation for industrialisation.
The policy challenge is to integrate distributed assets so that they strengthen the wider electricity system rather than becoming an expensive parallel network created to compensate for grid weakness.
What Does the Solar Boom Mean for Tanzania?
Tanzania occupies an interesting position in the report because it appears on both the consumption and manufacturing sides of Africa’s solar transition. It is one of only three African countries, alongside South Africa and Tunisia, identified by Ember as publishing some solar capacity information monthly or quarterly. That places Tanzania ahead of most of the continent in statistical visibility even though distributed installations are still difficult to measure completely.
The manufacturing story is more uncertain but potentially more economically significant. Ember expects African solar module production to increase from roughly 800 MW in 2025 to around 3.5 GW in 2026, with new production in Egypt and Tanzania driving much of the increase. It estimates Tanzania could produce around 500 MW during 2026, although the report repeatedly stresses that this figure is highly uncertain.
The report identifies one Tanzanian facility at Kwala in Kibaha operated by Tanzol, with a reported $300 million first phase and production equipment said to have been relocated from Vietnam and China. A special economic zone official reportedly confirmed in May that the facility was operating, but neither a start date nor confirmed annual capacity had been published. Estimates that the plant could reach 2 GW a year remain unverified, and Ember explicitly describes its own 500 MW output estimate as “very much a guess.” Chinese customs records show substantial cell exports to Tanzania during the first half of 2026, but also large wafer shipments even though no known Tanzanian facility can process wafers into cells, suggesting some material may be in transit rather than being used domestically.
Tanzania therefore illustrates both sides of the report’s central argument: the solar economy is expanding faster than the statistics needed to understand it.
Is Africa Building Its Own Solar Manufacturing Industry?
Manufacturing is growing, but Africa remains overwhelmingly dependent on Chinese technology. Ember estimates that 94% of solar panels installed in Africa during 2026 were imported from China. African module production could reach around 3.5 GW, equal to roughly one fifth of annual continental installations, but much of the new output in Egypt and Tanzania was initially designed for export to the United States rather than African buyers.
The value chain also remains shallow. Egypt has begun cell manufacturing and is considering production of wafers, glass and aluminium components, while the Tanzanian facility appears to undertake panel assembly using Chinese cells and relocated production equipment. Ember notes that solar glass is not currently manufactured anywhere in Africa and that other components including EVA, backsheets, ribbon and junction boxes are believed to remain imported.
New US tariffs may alter those economics. The report says tariff changes scheduled from December 2026 could reduce the attractiveness of exporting African manufactured panels and cells to the United States, while China’s removal of its solar export VAT rebate has increased Chinese panel prices. Some African production originally built around access to the US market could consequently become more competitive inside Africa.
That would represent an important transition. Africa currently imports the overwhelming majority of the equipment powering its solar boom. If domestic manufacturing increasingly serves African demand, part of the value associated with the energy transition can shift from imported equipment towards African industrial production. The depth of that shift will depend on whether manufacturing develops beyond final assembly into cells, glass, frames, batteries and other components.
What Is the Most Important Finding in the Report?
The 17 GW headline is important, but it is not the most consequential conclusion. The deeper finding is that Africa’s electricity system appears to be decentralising faster than the institutions responsible for planning it can measure.
The transition is being driven by individual economic decisions. A factory installs panels because electricity costs are high. A mine adds batteries because diesel is expensive. A hotel wants reliable supply. A telecom operator wants to keep towers running. Tens of thousands of these decisions aggregate into gigawatts of generating capacity without appearing in the procurement plans traditionally used to describe Africa’s power sector.
That creates an unusual energy transition. In many countries, the market is moving before policy. Governments are no longer deciding whether distributed solar should become important. Consumers have already begun making that decision.
The remaining question is whether African electricity policy catches up quickly enough to turn millions of privately financed generating assets into part of a coherent national power system.
If it does, distributed solar can reduce fuel imports, improve electricity reliability, support growing demand and reduce the amount of new centralised generation required. If governments continue planning with incomplete data, they risk building power systems around demand and capacity assumptions that are already obsolete.
Africa’s solar transition may be advancing faster than its electricity statistics because the most important new power producer is no longer always the state or the utility. It is increasingly the customer.
FAQ
How much solar will Africa install in 2026? Ember estimates that Africa will install around 17 GW of solar capacity in 2026, an increase of 45% from 2025 and equivalent to roughly 100,000 solar panels per day. The figure is an estimate based largely on Chinese customs data rather than a final official count.
Why is Africa’s solar capacity underestimated? Most recent growth appears to be distributed solar installed by customers on rooftops or commercial sites. These systems frequently fall outside utility procurement and national registration systems, making them difficult to capture in official data.
How much of Africa’s solar growth is distributed solar? Ember estimates that about 20 GW of the 26 GW added between 2023 and 2025, approximately 75%, was distributed solar.
Can solar meet Africa’s electricity demand growth? The report estimates that 17 GW of new solar could generate around 23 TWh annually, equivalent to 2.3% of Africa’s 2024 electricity generation. Historical electricity demand grew by an average of 2.2% annually between 2014 and 2024.
Is solar replacing diesel generators in Africa? The report finds strong evidence that solar and batteries are increasingly being used by businesses, mines and households that previously relied on diesel generators, particularly in markets with unreliable grids or high fuel prices.
Which African countries are installing the most solar in 2026? Ember estimates South Africa will install 3.3 GW, Egypt 2 GW, Nigeria and the DRC 1.7 GW each, Algeria 1.4 GW and Morocco 1 GW. Thirty six African countries are expected to set installation records.
Does Tanzania manufacture solar panels? The report identifies a solar panel assembly facility at Kwala in Kibaha and estimates Tanzanian production at roughly 500 MW in 2026, but it explicitly warns that the estimate is highly uncertain because confirmed production and customs data remain limited.
Why does better distributed solar data matter? Grid operators need accurate information to forecast demand, plan generation and batteries, manage voltage and congestion and understand future utility revenues. Incomplete data can lead governments to procure unnecessary generation or choose the wrong electricity mix.
 Uchumi360
Business Intelligence
Uchumi360 covers business, investment, and economic policy across East, Central, and Southern Africa.
For the serious reader
You read to the end. That places you in a small group.
Uchumi360 is built for readers who demand precision over speed, structure over sentiment, and analysis that holds uncomfortable conclusions rather than softening them. If this work sharpens how you think about Africa's economy, help us keep building the infrastructure behind it.
Institutional Partners
Commission intelligence. Shape the conversation.
Uchumi360 works with development finance institutions, investment firms, sovereign bodies, and strategic organisations across the coverage region. Institutional partnership unlocks:
- Commissioned sector and country intelligence reports
- Branded research series under your institution's authority
- Exclusive data briefings for internal strategy teams
- Speaking and editorial presence at Uchumi360 events
- Co-published investment outlooks for your markets
Support Our Work
Independent analysis has a cost. Help us bear it.
Uchumi360 does not carry advertising. It does not take editorial direction from sponsors. Every article is produced without commercial compromise. Your contribution funds the reporting, research, and editorial infrastructure that keeps this analysis free from influence.
Secure checkout: One-time and monthly support are processed securely. Add payment credentials to enable checkout here.
Stay Connected
Keep up with every new insight.
Follow our latest analysis, policy coverage, and market intelligence as soon as it is published. If you need something specific, reach out directly and we will point you to the right research.
