
China Added 428 GW of Electricity Capacity in 2024, More Than Africa's Entire 264 GW
Ready
A comparison of total electricity generating capacity across 54 African countries shows that the continent added approximately 24.8 GW between 2019 and 2024, while China added more than 1,350 GW. Although major projects in Tanzania, Ethiopia and other countries are accelerating expansion, the wider electricity deficit continues to constrain manufacturing, mineral processing, agricultural productivity and industrial competitiveness.
China added approximately 427.6 gigawatts (GW) of installed electricity generating capacity in 2024, more than the estimated 263.8 GW installed across all 54 sovereign African countries at the end of that year, according to data from the United States Energy Information Administration (EIA). The figures include generating capacity from coal, natural gas, oil, hydropower, nuclear, solar, wind and other electricity sources, providing a substantially broader measure of power sector development than comparisons limited to renewable energy.
The disparity becomes more pronounced over a longer period. Between the end of 2019 and the end of 2024, China's total installed generating capacity increased from approximately 2,025 GW to 3,377 GW, adding 1,351 GW in five years. Over the same period, the combined capacity of Africa's 54 sovereign countries increased from approximately 239.1 GW to 263.8 GW, a net addition of just 24.8 GW, based on Uchumi360's aggregation of EIA country figures.
China's additions in 2024
427.6 GW
Africa's entire installed stock, 2024
263.8 GW
Net generating capacity added, 2019 to 2024 All electricity technologies included. EIA international capacity data, with African values summed from 54 national observations. Rounded country values may produce small aggregation differences.
The comparison captures one of the central constraints on Africa's industrial development. Electricity is required to operate manufacturing equipment, process minerals, irrigate agricultural land, preserve food, power transport systems and support increasingly electricity intensive digital industries. Countries unable to supply sufficient and reliable electricity face limits on the productive activity they can support, even where they possess abundant natural resources, expanding populations and access to regional and international markets.
The data also show considerable variation within Africa. Egypt, South Africa, Algeria, Morocco and Nigeria have the continent's largest installed electricity systems. Ethiopia, Tanzania, Uganda and other countries have undertaken substantial capacity expansion, especially through hydropower. Yet many national systems remain small, and in several countries the installed capacity recorded by the EIA changed very little between 2019 and 2024.
A further distinction is necessary. Installed generating capacity measures the rated output of electricity equipment, expressed in megawatts or gigawatts. Actual electricity production is measured in gigawatt hours (GWh) or terawatt hours (TWh) and depends on whether the equipment operates, the availability of fuel or water, maintenance, demand and network conditions. A country may possess substantial installed capacity while producing comparatively little electricity.
Africa's challenge therefore involves both expanding the quantity of generating infrastructure and ensuring that existing capacity produces reliable power that can reach businesses and households at commercially viable prices.
What Total Electricity Capacity Shows Across Africa
The EIA's internationally comparable figures establish that Africa's electricity infrastructure is concentrated in a relatively small number of countries. In 2024, Egypt had approximately 63.45 GW of installed generating capacity, and South Africa had 63.43 GW. Together, these two systems accounted for approximately 48% of the combined total across the 54 African countries examined.
Algeria followed with 22.60 GW, Morocco 15.70 GW, Nigeria 14.15 GW and Libya 11.42 GW. Most African countries had less than 5 GW of total installed capacity in the same dataset.
The concentration affects the continent's ability to develop industries requiring large and continuous electricity supplies. Egypt's generating system supports a sizeable manufacturing economy, while South Africa's power infrastructure was developed around extensive industrial and mining demand. Other countries have considerably smaller systems and face a different investment challenge, particularly where population growth is increasing the demand for electricity more rapidly than national utilities can expand supply.
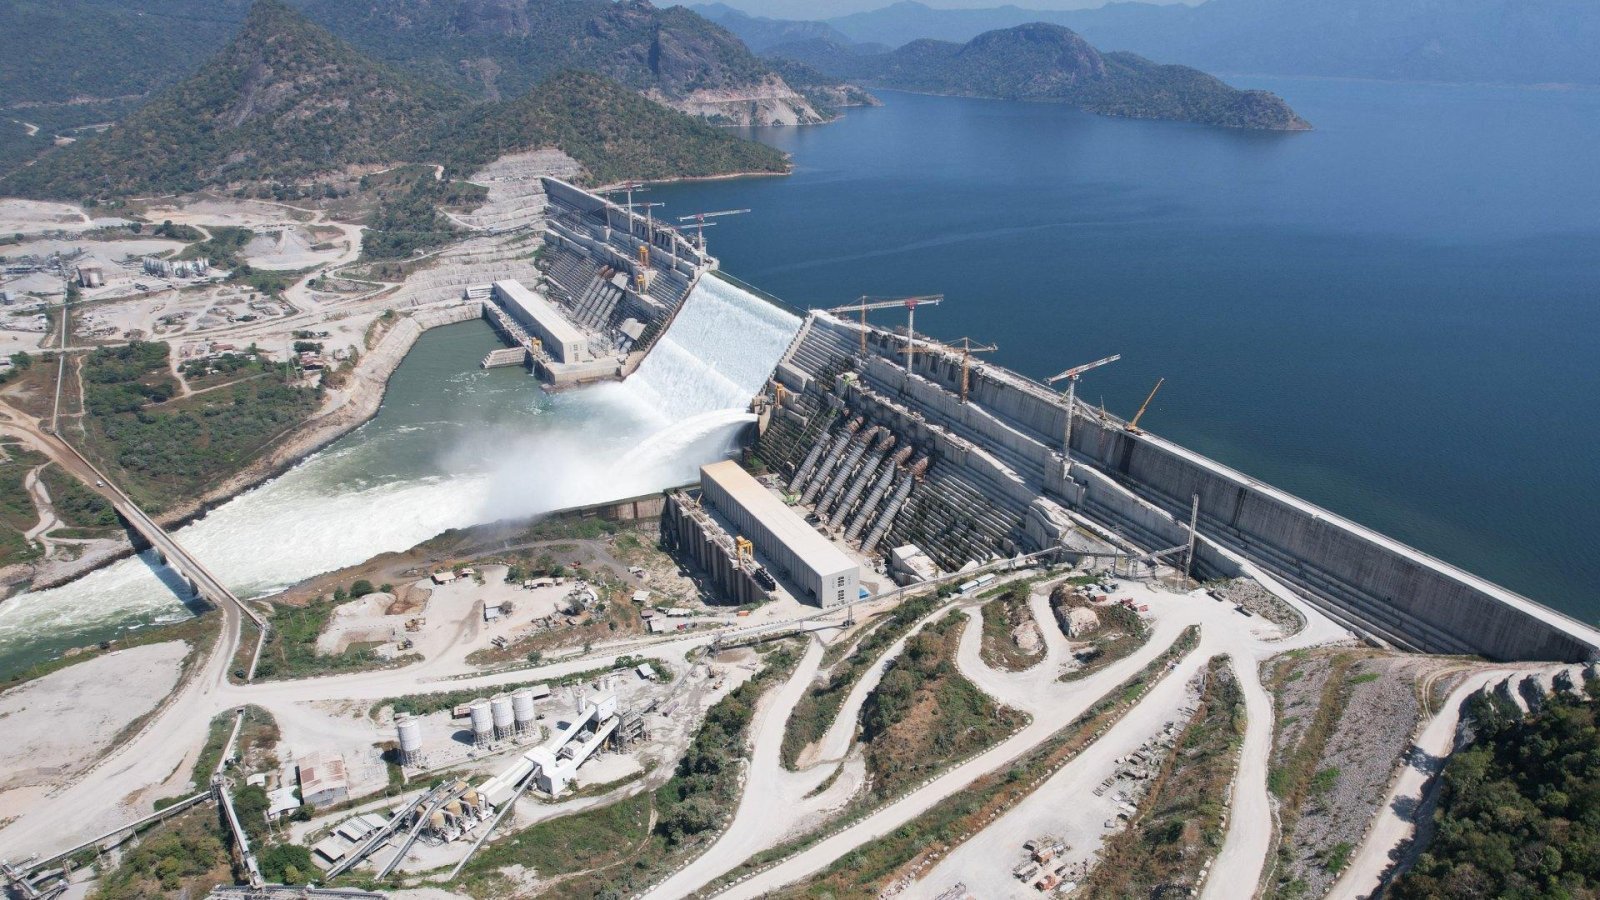
The EIA series should be treated as a common historical comparison, not the final word on current national capacity. It ends in 2024, and several countries have since commissioned new projects. Tanzania's Julius Nyerere Hydropower Project, for example, has materially increased the country's generating capacity, with EWURA reporting 4.54 GW of domestic installed capacity in March 2026.
The latest national figures are therefore examined separately from the historical EIA comparison to avoid combining different reporting periods or definitions into one misleading ranking.
Africa's Total Electricity Capacity, Country by Country
The following table uses EIA figures for installed electricity generating capacity from all technologies. It compares the end of 2019 with the end of 2024, providing a common five-year period across all 54 sovereign African countries. It therefore excludes major projects commissioned after 2024.
Table 1. Total installed electricity generating capacity, 2019 to 2024
All sources included. Figures in GW, rounded to two decimal places. A change of 0.10 GW equals 100 MW.
| Country | 2019 | 2024 | Net added |
| Egypt | 59.08 | 63.45 | +4.37 |
| Nigeria | 11.69 | 14.15 | +2.46 |
| South Africa | 60.99 | 63.43 | +2.44 |
| Ethiopia | 4.84 | 6.78 | +1.94 |
| Morocco | 14.01 | 15.70 | +1.69 |
| Tanzania | 1.61 | 2.73 | +1.12 |
| Tunisia | 5.93 | 6.98 | +1.05 |
| Zambia | 3.07 | 4.06 | +0.99 |
| Algeria | 21.70 | 22.60 | +0.90 |
| Libya | 10.52 | 11.42 | +0.90 |
| Uganda | 1.38 | 2.06 | +0.68 |
| Guinea | 0.62 | 1.28 | +0.66 |
| Kenya | 3.20 | 3.74 | +0.54 |
| Ghana | 5.42 | 5.96 | +0.54 |
| Senegal | 1.47 | 1.91 | +0.44 |
| Côte d'Ivoire | 2.24 | 2.65 | +0.41 |
| Mali | 0.92 | 1.33 | +0.41 |
| Burkina Faso | 0.39 | 0.79 | +0.40 |
| Somalia | 0.09 | 0.48 | +0.39 |
| DR Congo | 2.90 | 3.29 | +0.39 |
| Sudan | 3.71 | 4.01 | +0.30 |
| Madagascar | 0.60 | 0.88 | +0.28 |
| Mauritania | 0.66 | 0.85 | +0.19 |
| Mozambique | 2.71 | 2.89 | +0.18 |
| Republic of Congo | 0.67 | 0.84 | +0.17 |
| Togo | 0.23 | 0.36 | +0.13 |
| Rwanda | 0.26 | 0.37 | +0.11 |
| Central African Republic | 0.04 | 0.13 | +0.09 |
| Chad | 0.09 | 0.17 | +0.08 |
| Djibouti | 0.13 | 0.21 | +0.08 |
| Niger | 0.32 | 0.38 | +0.06 |
| Zimbabwe | 2.46 | 2.52 | +0.06 |
| Malawi | 0.68 | 0.78 | +0.10 |
| Gambia | 0.14 | 0.19 | +0.05 |
| Mauritius | 0.94 | 0.99 | +0.05 |
| Benin | 0.47 | 0.51 | +0.04 |
| Burundi | 0.09 | 0.13 | +0.04 |
| Cameroon | 1.76 | 1.80 | +0.04 |
| Namibia | 0.62 | 0.66 | +0.04 |
| Eswatini | 0.28 | 0.28 | 0.00 |
| Equatorial Guinea | 0.35 | 0.35 | 0.00 |
| Gabon | 0.78 | 0.80 | +0.02 |
| Liberia | 0.19 | 0.21 | +0.02 |
| Lesotho | 0.08 | 0.10 | +0.02 |
| Sierra Leone | 0.24 | 0.26 | +0.02 |
| Cabo Verde | 0.19 | 0.20 | +0.01 |
| Eritrea | 0.22 | 0.23 | +0.01 |
| Guinea Bissau | 0.03 | 0.04 | +0.01 |
| São Tomé and Príncipe | 0.03 | 0.04 | +0.01 |
| Botswana | 0.77 | 0.76 | -0.01 |
| Comoros | 0.04 | 0.03 | -0.01 |
| Seychelles | 0.16 | 0.15 | -0.01 |
| South Sudan | 0.12 | 0.06 | -0.06 |
| Angola | 6.94 | 6.86 | -0.08 |
| 54 country total | 239.07 | 263.83 | +24.76 |
Source: US Energy Information Administration, International Energy Statistics, reproduced in the all technology country capacity dataset. Uchumi360 calculations use the displayed country estimates. Small changes can be affected by source revisions and rounding. Negative changes indicate a decrease in the recorded installed stock, not necessarily the absence of new construction.
The table indicates that 40 of the 54 countries recorded net generating capacity increases of no more than 500 MW across the five years. Within that group, 27 recorded increases of 100 MW or less, including countries where the installed stock declined.
However, a country with very little installed capacity can still experience a large proportional increase from a relatively small project. Similarly, the addition of a large power plant can materially change the statistics for a smaller electricity system without necessarily resolving its transmission, distribution or reliability problems.
The common historical comparison is most useful for establishing where the expansion of generating infrastructure was concentrated. More recent country reports are necessary to assess developments since 2024.
How Much Electricity Are African Countries Actually Generating?
A country's installed generating capacity establishes how much electricity its equipment could theoretically produce at full rated output. It does not establish how much electricity is available to businesses.
Annual electricity production provides a more direct measure of the system's operating output. A generator rated at 1,000 MW could theoretically produce 8.76 TWh in a year if operated continuously at full capacity, but actual production depends on operating hours, fuel or water availability, maintenance requirements and the utilisation of the equipment.
For this reason, the next comparison uses annual electricity generation rather than installed capacity.
Table 2. Annual electricity generation across African economies
Latest available Ember figures, including fossil fuels, hydro, nuclear, solar, wind and other generating technologies. TWh per year.
| Country | Year | Electricity generated |
| South Africa | 2025 | 243.0 |
| Egypt | 2025 | 242.0 |
| Algeria | 2024 | 96.4 |
| Morocco | 2025 | 46.3 |
| Nigeria | 2025 | 45.6 |
| Libya | 2024 | 34.6 |
| Ethiopia | 2025 | 33.5 |
| Ghana | 2024 | 24.3 |
| Tunisia | 2025 | 23.0 |
| Mozambique | 2024 | 19.8 |
| Zambia | 2024 | 19.7 |
| DR Congo | 2024 | 15.9 |
| Angola | 2024 | 15.6 |
| Kenya | 2025 | 15.3 |
| Sudan | 2024 | 14.8 |
| Côte d'Ivoire | 2024 | 10.8 |
| Zimbabwe | 2024 | 10.3 |
| Tanzania | 2024 | 8.84 |
| Senegal | 2024 | 7.63 |
| Cameroon | 2024 | 7.26 |
| Mali | 2024 | 5.96 |
| Uganda | 2024 | 5.81 |
| Republic of Congo | 2024 | 5.46 |
| Guinea | 2024 | 4.03 |
| Botswana | 2024 | 3.43 |
| Mauritius | 2024 | 3.41 |
| Gabon | 2024 | 2.60 |
| Madagascar | 2024 | 2.43 |
| Mauritania | 2024 | 2.07 |
| Malawi | 2024 | 1.83 |
| Burkina Faso | 2024 | 1.69 |
| Namibia | 2024 | 1.64 |
| Equatorial Guinea | 2024 | 1.49 |
| Rwanda | 2024 | 1.13 |
Source: Ember's Yearly Electricity Data, reproduced in the country electricity generation comparison. The reporting year is shown because complete 2025 figures were not available for every country. This is a selection of countries with retrieved values, not a complete 54 country generation table.
South Africa and Egypt dominate electricity production in Africa, each generating approximately 243 TWh annually in 2025. By comparison, Nigeria generated 45.6 TWh, Ethiopia 33.5 TWh, and Kenya 15.3 TWh, according to the latest Ember estimates.
The differences are substantial even before adjusting for population. But total production alone cannot establish the electricity available to industrial users, because some electricity is consumed by households, public services and commercial businesses, while other volumes are exported or lost before reaching final customers.
The figures also reflect different economic structures. South Africa has a sizeable industrial base and energy intensive mining activities, while Egypt's electricity demand is supported by manufacturing, urban development and a large domestic economy. Smaller countries may have lower absolute production because their populations and industrial systems are smaller.
Nevertheless, inadequate electricity supply can prevent the development of industries that would otherwise create additional demand.
Table 3. Electricity generation in the remaining African countries
Latest available Ember observations, converted to TWh. For reference, 0.10 TWh equals 100 GWh.
| Country | Year | Generated TWh |
| Benin | 2024 | 1.01 |
| Niger | 2024 | 0.95 |
| Togo | 2024 | 0.71 |
| Seychelles | 2024 | 0.63 |
| Eswatini | 2024 | 0.61 |
| Liberia | 2024 | 0.57 |
| South Sudan | 2024 | 0.56 |
| Cabo Verde | 2024 | 0.52 |
| Gambia | 2024 | 0.51 |
| Burundi | 2024 | 0.49 |
| Eritrea | 2024 | 0.45 |
| Somalia | 2024 | 0.43 |
| Chad | 2024 | 0.37 |
| Sierra Leone | 2024 | 0.21 |
| Djibouti | 2024 | 0.20 |
| Central African Republic | 2023 | 0.14 |
| Comoros | 2023 | 0.14 |
| São Tomé and Príncipe | 2023 | 0.09 |
| Guinea Bissau | 2024 | 0.08 |
| Lesotho | 2024 | Not reliably reported |
Source: Ember annual electricity statistics. Lesotho's zero value in the retrieved secondary compilation is not treated as evidence that the country generated no electricity. Together with Table 2, this covers all 54 sovereign African countries, with the listed reporting limitations.
National Regulators Show How Much Has Changed Since 2024
International datasets take time to incorporate new generating stations, changes in plant availability and revisions to national electricity accounts. Several African countries have consequently recorded substantial growth since the end of the EIA comparison period.
Tanzania illustrates the difference most clearly. The National Bureau of Statistics reports that national grid installed capacity increased from 1,357.7 MW in 2016 to 3,980.6 MW in 2025, while annual electricity generation rose from approximately 6,991 GWh to 13,887 GWh. The commissioning of Julius Nyerere Hydropower accounts for much of the recent capacity increase.
EWURA's March 2026 update subsequently placed Tanzania's domestically installed capacity at approximately 4,543 MW. This includes generation connected to the main grid, generation outside the main grid and facilities producing electricity for their own consumption. It excludes the 67 MW of reported import capacity.
Uganda has also expanded generating capacity, reaching approximately 2,098 MW at the end of 2025, according to the Electricity Regulatory Authority. Its electricity production increased from 6,788.5 GWh in 2024 to 8,021.8 GWh in 2025, an 18% increase associated partly with additional hydropower production.
Ghana's Energy Commission reports a further example of sustained capacity growth. The country reached 5,840 MW of installed capacity in 2025, including approximately 4,073 MW of thermal generation, 1,584 MW of hydropower and 183 MW from other renewable sources. This confirms that substantial power sector investment has occurred through natural gas and other technologies that would be missed by a renewable only comparison.
Table 4. Newer national electricity statistics
| Country | Latest year | Installed capacity | Annual electricity output |
| Tanzania | 2025/2026 | 4,543 MW | 13.89 TWh in 2025 |
| Kenya | FY 2025/26 | 3,987 MW* | 15.69 TWh* |
| Uganda | 2025 | 2,098 MW | 8.02 TWh |
| Ghana | 2025 | 5,840 MW | Refer to national generation series |
| Nigeria | October 2026 | Approximately 13,625 MW grid installed | 4,047 MW average grid output during October |
Kenya's published EPRA system total includes an import capacity allocation, while the electricity output figure includes imports and therefore represents broader grid supply rather than solely domestic generation. Nigeria's figure is average power output in MW, not annual energy in TWh. Sources: NBS, EWURA, EPRA, Uganda ERA, Ghana Energy Commission and Nigeria NERC.
These examples establish that Africa's electricity development is uneven. Some countries are investing in major projects, while others have expanded their generation systems much more slowly. The continent's power deficit therefore cannot be explained simply as an absence of investment; it also reflects the concentration of investment, the performance of existing plants and the ability of national electricity systems to deliver power reliably.
Nigeria Shows Why Building Power Stations Does Not Guarantee Electricity Supply
Nigeria's electricity system presents a particularly important distinction between installed generating capacity and power actually available to customers.
Although the country possesses approximately 13.6 GW of grid connected installed capacity, the Nigerian Electricity Regulatory Commission reported average available capacity of 4,744 MW in October 2026. Average actual generation was 4,047 MW. This indicates that a substantial share of the country's installed generating infrastructure was unavailable for dispatch during the period.
 The reasons are connected to fuel supply, maintenance, technical availability, grid constraints and the financial position of electricity companies. Even when demand exists, power stations cannot operate at their rated capacity if fuel supply is interrupted or transmission infrastructure cannot accommodate their output.
For manufacturers, the consequences are immediate. Businesses may be forced to purchase private generators, pay for diesel, maintain backup equipment or stop production when electricity becomes unavailable. Such costs weaken profitability and can discourage investment in electricity intensive industries.
A larger national power system therefore creates economic benefits only when its capacity can be used consistently.
More Electricity Supports Economic Growth, but Its Productive Use Determines the Return
Electricity contributes to economic growth by allowing businesses to operate machinery, expand production, improve storage, automate processes and reduce the labour and time required to produce goods.
In agriculture, electricity can support irrigation, refrigeration and processing. In manufacturing, it powers production equipment and makes it possible to operate larger, more specialised facilities. In mining, electricity is required for extraction, crushing, smelting and refining, while transport and logistics increasingly depend on electrically powered equipment and digital control systems.
The relationship between electricity consumption and economic growth is therefore substantial, but the direction of causation is not automatic. Growing economies demand more electricity because businesses expand and households purchase additional appliances. At the same time, reliable electricity enables activities that would otherwise be more expensive or technically difficult.
A government commissioning a large power station cannot assume that the project will generate equivalent increases in GDP. The economic return depends on whether businesses can obtain electricity, whether industrial investment increases, whether tariffs remain commercially viable and whether the infrastructure operates reliably.
For Tanzania, the expansion associated with Julius Nyerere Hydropower creates an opportunity to increase electricity use in manufacturing, mining, agricultural processing and other productive sectors. The existence of additional generating capacity provides a necessary foundation, but transmission connections, investment conditions and commercial demand will determine the resulting industrial benefits.
For Ethiopia, major hydropower development can support industrial activity and regional electricity exports. However, additional generation must be matched by transmission infrastructure and reliable customers.
For the DRC and Zambia, the availability of dependable power remains central to prospects for expanding domestic mineral processing. Copper smelting, refining and other electricity intensive operations require substantial and continuous energy supplies. When that supply is inadequate, mineral producing countries face additional difficulty attracting investment into higher value industrial production.
Electricity Outages Are Imposing Measurable Costs on African Firms
The World Bank's November 20, 2026 analysis of Enterprise Surveys provides evidence of how unreliable electricity affects business performance.
The research examined 292,581 firm interviews from 186 economies over the period 2005 to 2025. In Sub Saharan Africa, approximately 74% of surveyed firms reported electricity outages, while affected firms estimated losses equivalent to an average of 5.2% of annual sales.
Firms reporting outages
74%
Average sales losses among affected firms
5.2%
The World Bank found that owning a generator did not necessarily eliminate the sales losses associated with unreliable electricity. Businesses still incurred operating expenses and production disruptions, while firms with access to credit were generally better able to acquire backup equipment.
The results explain why electricity reliability can influence industrial competitiveness even when national installed capacity appears substantial. A company operating in a market with frequent outages may incur higher production costs than a comparable business in a country where electricity is supplied continuously.
The economic burden is particularly difficult for smaller enterprises. Large companies may finance dedicated power facilities, but smaller manufacturers and processors often have fewer resources to protect themselves against interruptions.
Africa's Industrial Ambitions Require Greater Electricity Investment
The International Energy Agency reports that South Africa and North Africa together account for more than 65% of Africa's installed electricity capacity and over 45% of energy investment, despite representing less than 20% of the continent's population. This concentration leaves the remaining African economies competing for a much smaller share of electricity infrastructure investment relative to the size of their populations.
The investment challenge includes project financing, the financial condition of national electricity utilities, transmission infrastructure and the commercial risks associated with electricity supply.
Large power plants require substantial capital before they begin producing electricity. Investors need confidence that electricity buyers can honour payments and that the transmission system can deliver electricity to customers. Governments often provide guarantees or other financial support, creating fiscal obligations that must be managed alongside existing expenditure and debt commitments.
Industrial demand also affects investment decisions. Electricity developers require customers capable of purchasing power over many years, while industrial investors require reliable electricity before committing to new factories. Governments therefore need to coordinate electricity development with industrial planning rather than treating the two as unrelated programmes.
Regional electricity trade could help address some of these constraints. Countries with surplus generating capacity may supply neighbouring markets, while smaller electricity systems can gain access to more diversified sources of power. This requires transmission interconnections, commercial agreements and reliable operation across borders.
The African Continental Free Trade Area creates a further economic opportunity by expanding potential markets for manufactured products. However, improved market access will be less valuable to producers if electricity shortages prevent them from manufacturing goods at competitive costs.
Africa Has Begun Expanding Power Capacity, but the Industrial Gap Remains
The verified EIA comparison establishes that Africa's electricity generating infrastructure expanded much more slowly than China's between 2019 and 2024. The continent's 54 sovereign countries added approximately 24.8 GW of net installed capacity during that period, compared with China's 1,351 GW.
The comparison also reveals considerable differences among African countries. Egypt and South Africa possess generating systems exceeding 60 GW each, while several countries have installed capacity measured in hundreds rather than thousands of megawatts. Some national systems recorded little net expansion during the five year period, while others invested in major new infrastructure.
Tanzania Has More Than Doubled Electricity Capacity Since 2016
Tanzania's electricity infrastructure has undergone a substantial expansion, contradicting any general suggestion that the country has added only small amounts of generating capacity over the past decade. More recent national statistics demonstrate that the picture is changing. Tanzania's electricity capacity has increased considerably following the commissioning of Julius Nyerere Hydropower, Uganda has expanded production through hydropower, and Ghana has increased installed capacity through thermal and other generation technologies. Data published in the National Bureau of Statistics' Statistical Abstract 2025 show that national grid installed generating capacity increased from 1,357.7 MW in 2016 to 3,980.6 MW in 2025. That represents a net addition of approximately 2,623 MW and a 193% increase over nine years.
Electricity actually generated also increased. Annual production rose from 6,990.7 gigawatt hours (GWh) in 2016 to 13,887.3 GWh in 2025, representing growth of approximately 99%.
Yet additional megawatts alone cannot establish whether electricity constraints have been resolved. Nigeria's experience demonstrates that installed capacity can substantially exceed actual available generation, while the World Bank's firm surveys show the financial costs associated with unreliable electricity.
The economic implications extend beyond household electrification. Governments seeking to increase manufacturing, develop mineral processing, expand agricultural industries and attract digital infrastructure investment require electricity systems capable of supplying large volumes of dependable power at competitive prices.
The next decade of African industrial development will depend partly on how quickly governments can expand generating capacity, improve the utilisation of existing equipment and ensure that electricity reaches productive enterprises.
The capacity figures provide a measure of the infrastructure gap. The generation statistics and business performance evidence show why closing that gap will require sustained investment across the entire electricity supply system.
 Uchumi360
Business Intelligence
Uchumi360 covers business, investment, and economic policy across East, Central, and Southern Africa.
For the serious reader
You read to the end. That places you in a small group.
Uchumi360 is built for readers who demand precision over speed, structure over sentiment, and analysis that holds uncomfortable conclusions rather than softening them. If this work sharpens how you think about Africa's economy, help us keep building the infrastructure behind it.
Institutional Partners
Commission intelligence. Shape the conversation.
Uchumi360 works with development finance institutions, investment firms, sovereign bodies, and strategic organisations across the coverage region. Institutional partnership unlocks:
- Commissioned sector and country intelligence reports
- Branded research series under your institution's authority
- Exclusive data briefings for internal strategy teams
- Speaking and editorial presence at Uchumi360 events
- Co-published investment outlooks for your markets
Support Our Work
Independent analysis has a cost. Help us bear it.
Uchumi360 does not carry advertising. It does not take editorial direction from sponsors. Every article is produced without commercial compromise. Your contribution funds the reporting, research, and editorial infrastructure that keeps this analysis free from influence.
Secure checkout: One-time and monthly support are processed securely. Add payment credentials to enable checkout here.
Stay Connected
Keep up with every new insight.
Follow our latest analysis, policy coverage, and market intelligence as soon as it is published. If you need something specific, reach out directly and we will point you to the right research.
