
How Much Do Airlines Actually Make? Inside the Economics of a US$1.17 Trillion Industry
Ready
Global airlines are expected to generate about US$1.17 trillion in revenue in 2026 but keep only US$23 billion in net profit, equivalent to roughly US$4.50 for every passenger carried. The economics behind that thin margin explain why airlines obsess over aircraft utilisation, fuel, fares, cargo, premium cabins and every empty seat.
Commercial aviation is one of the largest industries in the world, moving more than five billion passengers a year, generating more than US$1 trillion in annual revenue and deploying aircraft that can cost well above US$100 million each. Yet beneath the scale and glamour sits one of the thinnest profit structures in global business. The International Air Transport Association expects airlines to generate about US$1.17 trillion in revenue in 2026, but retain only US$23 billion as net profit, equivalent to a margin of just 2 percent. Spread across more than 5.1 billion passengers, that leaves the industry with an average net profit of only US$4.50 for every person carried, down from US$9.10 in 2025 as higher fuel prices and disruption in the Middle East sharply increased operating costs.
That number immediately changes how airline economics should be understood. A passenger may pay US$500 for a ticket and assume the airline is making hundreds of dollars from the journey, but the vast majority of that revenue is absorbed before the aircraft reaches its destination. Fuel, aircraft financing, maintenance, pilots and cabin crew, airport charges, navigation fees, insurance, ground handling, catering, distribution systems, technology, administration and taxes all compete for the same fare. IATA expects the global airline fuel bill alone to reach about US$351 billion in 2026, with fuel accounting for 31.4 percent of operating costs. Industry revenues are expected to rise by around 9.5 percent this year, but expenses are forecast to increase by 13.1 percent, which explains how a trillion dollar industry can lose half of its expected profitability without passenger demand collapsing.
The more useful question is therefore not how much airlines charge passengers, but how much revenue they generate from every unit of capacity relative to the cost of producing it.
Airlines Sell Something That Becomes Worthless the Moment the Plane Leaves
The defining characteristic of airline economics is that the product cannot be stored. A manufacturer can keep unsold goods in a warehouse and try again tomorrow. A hotel can sell another room the following night. An airline loses the value of an empty seat permanently when the aircraft door closes. If a 200 seat aircraft departs with 160 passengers, the remaining 40 seats have disappeared as commercial inventory even though almost all the costs required to operate them have already been incurred.
This is why airlines measure their businesses through concepts such as Available Seat Miles in the United States and Available Seat Kilometres elsewhere. A 200 seat aircraft flying 1,000 kilometres creates 200,000 available seat kilometres regardless of whether one passenger or 200 passengers are onboard. Revenue Passenger Kilometres then measure how much of that capacity has actually been sold, while the passenger load factor expresses the proportion occupied by paying travellers. A flight carrying 180 passengers on a 200 seat aircraft therefore operates at a 90 percent load factor, but that figure alone says surprisingly little about profitability because the airline may still have sold the seats too cheaply.
The more revealing relationship is between revenue and cost per unit of capacity. American carriers commonly use RASM, revenue per available seat mile, and CASM, cost per available seat mile. If an airline generates 13 cents of revenue while spending 12 cents to produce each available seat mile, the difference is only one cent. Across 100 billion available seat miles, however, that one cent becomes US$1 billion. Reverse the relationship and the same airline can lose US$1 billion even while carrying millions of passengers.
This is the arithmetic that makes aviation unusually unforgiving. Airline profitability can change materially because of a movement measured in fractions of a cent.
Delta and Ryanair Show Two Completely Different Ways to Make Money
The contrast between Delta Air Lines and Ryanair shows that airlines can reach profitability through very different commercial models. Delta generated US$63.4 billion in operating revenue in 2025 and US$5.8 billion in operating income, while adjusted pretax income reached US$5 billion on US$58.3 billion of adjusted operating revenue. Its adjusted pretax margin was 8.5 percent, far above the global airline industry average.
Delta’s strength increasingly comes from extracting more revenue from passengers rather than simply carrying more of them. Premium cabins, corporate travel, loyalty programmes, lounges, credit card partnerships, cargo and other businesses allow the carrier to earn significantly more from the same aircraft than a simple economy fare would suggest. The airline has gradually built a model in which the passenger is not merely purchasing transportation between two cities but buying into a wider commercial relationship that can include premium seating, airport services, loyalty rewards and financial products.
Ryanair reaches a strong margin from almost the opposite direction. It carried 208.4 million passengers in the financial year ending March 2026 and generated €15.54 billion in revenue, including €4.99 billion from ancillary services such as luggage, reserved seats, priority boarding and other products. Profit after tax before exceptional items reached €2.26 billion. That works out to roughly €10.84 in profit for every passenger carried, more than twice the current global average, even though Ryanair is built around some of the lowest headline fares in Europe.
The explanation is cost discipline. Ryanair’s operating costs rose by 6 percent while traffic expanded by 4 percent, but unit costs increased by only about 1 percent. Ancillary revenue averaged approximately €24 per passenger, meaning a traveller attracted by a low advertised fare can ultimately be worth considerably more once baggage, seat selection and other services are added. Its fleet economics matter as well. By March 2026, Ryanair was operating 210 Boeing 737 8200 aircraft within a fleet of 647, while fuel hedging had already locked in 80 percent of its FY2027 jet fuel requirement at US$668 per metric tonne.
Delta therefore tries to push revenue per passenger upward. Ryanair tries to drive cost per passenger downward while separately monetising almost everything around the seat. Both models can produce attractive profits, but the underlying arithmetic remains the same: revenue per unit of capacity must remain higher than the cost of producing that capacity.
A Full Plane Can Still Lose Money
One of the most misleading indicators in aviation is the full aircraft. Airlines regularly publicise passenger numbers and load factors because they demonstrate demand, but neither proves that a route is commercially viable. An airline can fill 95 percent of its seats by discounting aggressively and still lose money if the average fare does not cover the cost of the flight. Another carrier can operate at a lower load factor but earn more because business class passengers, cargo, higher fares and ancillary income produce significantly more revenue from the same aircraft.
Consider a simplified 180 seat aircraft. If the flight costs US$30,000 and the average passenger contributes US$200, carrying 100 passengers generates only US$20,000 and leaves the airline US$10,000 short. At 150 passengers, revenue reaches US$30,000 and the flight roughly breaks even. At 170 passengers, revenue rises to US$34,000, and much of the additional US$4,000 can contribute directly toward profit because the pilots, landing charges, aircraft lease and most other operating costs were already committed.
That is why the final seats sold on a flight can matter disproportionately, but it is also why airlines do not necessarily sell every remaining seat cheaply. Revenue management systems continually estimate whether accepting US$200 today is more profitable than holding the seat for a passenger who may pay US$600 tomorrow. The aircraft therefore becomes a moving market in which the airline is constantly trying to maximise revenue from a fixed and rapidly expiring stock of seats.
The same logic extends to premium cabins. A business class seat occupies more space, but it can generate several times the revenue of an economy passenger. Cargo carried beneath the passenger cabin adds another revenue stream without requiring a separate flight. A route that looks weak when judged purely on passenger fares can become viable when freight and connecting traffic are included.
Fuel Is Large Enough to Destroy an Airline’s Margin Without Changing Demand
The 2026 global outlook demonstrates why airline executives spend so much time watching oil markets. IATA expects jet fuel to absorb nearly a third of operating costs this year, with the industry’s fuel bill reaching approximately US$351 billion. The result is that airlines can improve passenger numbers, fill more seats and increase ticket revenue while still becoming less profitable if fuel rises faster than fares.
Kenya Airways illustrates that problem clearly. In the first half of 2026, the airline increased revenue by 9 percent to KSh81 billion despite operating with 9 percent less capacity. Cabin factor improved by four percentage points and average ticket values strengthened, showing that demand remained resilient. Yet fuel costs increased 32 percent, total operating costs rose 14 percent and Kenya Airways reported a KSh16.1 billion after tax loss. Fuel alone represented approximately 32 percent of total operating expenditure and more than half of direct operating costs.
This is important because the airline did many of the things commonly associated with commercial improvement. It earned more revenue from less capacity, improved utilisation and filled a greater proportion of its seats. The cost environment still overwhelmed those gains.
Aircraft availability added another complication. Kenya Airways has been affected by global shortages of engines, components and spare parts, which reduced the number of aircraft available to generate revenue even though ownership, financing and other costs continued. An aircraft sitting on the ground does not simply stop earning. It continues consuming capital.
That is one reason utilisation is so important. Two airlines may own identical aircraft, but the carrier that keeps each airframe productive for twelve or thirteen hours a day can spread its fixed costs across considerably more passengers and seat kilometres than one achieving eight or nine hours.
Ethiopian Airlines Shows What Scale and Network Economics Can Do in Africa
Ethiopian Airlines is the most important African counterpoint to the idea that airlines on the continent are inherently condemned to poor economics. The group generated US$9.1 billion in revenue during the 2025/26 financial year, carried 20.7 million passengers and transported 897,000 tonnes of cargo. Passenger traffic increased by 8 percent while cargo volumes rose by 16 percent.
Its advantage is not simply that it owns more aircraft than most African carriers. Ethiopian has built a network in which Addis Ababa functions as a continental transfer point, allowing passengers originating in dozens of smaller African markets to be aggregated onto long haul services to Europe, Asia, the Middle East and the Americas. A route from a relatively small African capital can therefore remain economically useful because passengers arriving in Addis Ababa are feeding several larger international services.
The group also earns revenue from activities beyond passenger transportation, including cargo, maintenance, aviation training and other services. That makes its economics fundamentally different from a smaller national airline attempting to sustain itself mainly from ticket revenue on a limited collection of domestic and international routes.
Cargo is particularly important. Aircraft flying from African agricultural markets to Europe, Asia and the Middle East can carry flowers, fresh produce, pharmaceuticals and other high value goods beneath the passenger cabin. The passenger network and cargo network then reinforce each other, increasing revenue generated by aircraft that would otherwise fly with unused belly capacity.
Scale therefore matters, but network design matters more. A fleet becomes economically powerful when each aircraft feeds a system capable of combining passengers, cargo and connecting traffic from multiple markets.
Air Tanzania Shows Why Buying Aircraft Is Not the Same as Building a Profitable Airline
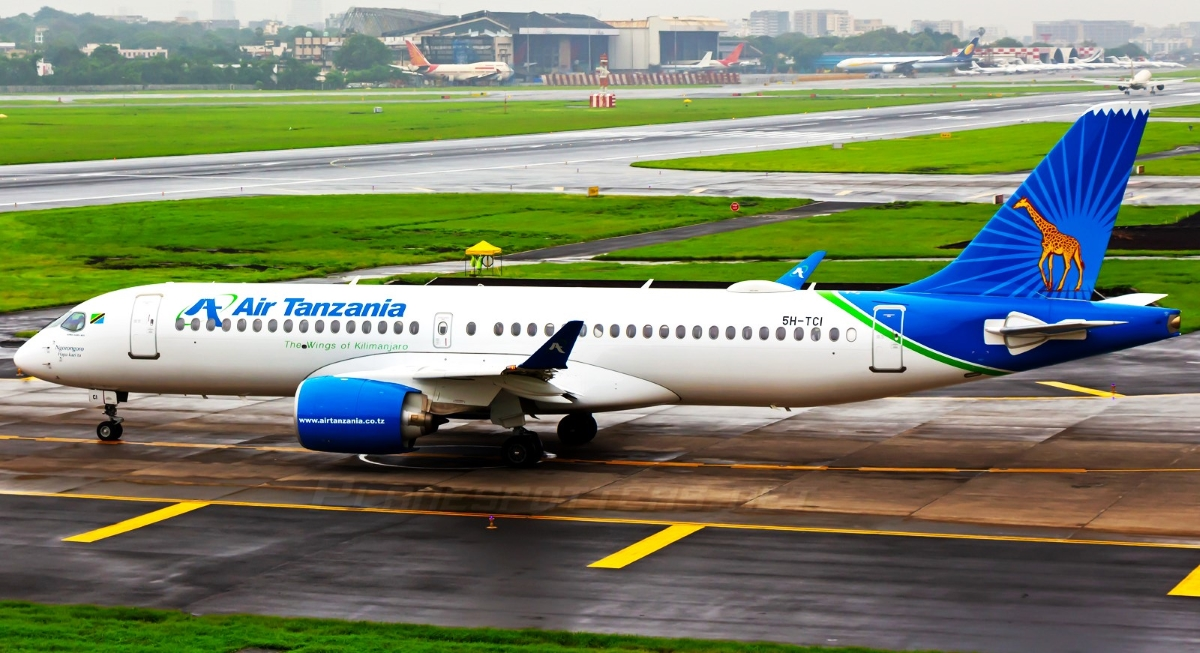
Tanzania has invested heavily in rebuilding Air Tanzania and restoring the country’s national carrier after years of decline. The airline now operates a substantially larger and more modern fleet and has expanded domestic, regional and long haul services. That investment has strategic arguments around connectivity, tourism, trade and national transport infrastructure, but the financial results also demonstrate that fleet expansion alone does not solve airline economics.
The Controller and Auditor General reported that Air Tanzania’s net loss increased from TSh91.79 billion in 2023/24 to TSh191.19 billion in 2024/25 despite TSh114 billion in government support. The audit attributed the deterioration partly to costs increasing faster than revenue, particularly aircraft maintenance, staff expenses and financing costs associated with fleet expansion and lease obligations. It also found passenger and cargo volumes below target and load factors below expected levels.
More revealingly, the CAG found that a significant number of routes operated below break even, including routes generating negative contribution margins despite moderate load factors. That distinction goes directly to the central economics of aviation. A reasonably full aircraft can still destroy value if fares, cargo income and other revenue do not cover the costs assigned to the route.
The audit also questioned how ATCL was deploying its Boeing 767 freighter, noting that it was concentrated on short and medium haul operations rather than potentially higher yielding long haul markets, while weaknesses in revenue systems, contracts and refund controls created additional exposure to revenue leakage.
The lesson should not be reduced to whether Tanzania should or should not own an airline. National carriers can create economic benefits extending beyond their own balance sheets through tourism, connectivity, cargo and strategic access. But once those wider objectives are accepted, the financial cost should still be measured accurately. A government can deliberately subsidise a route because it considers the wider economic return worthwhile. What becomes dangerous is operating routes without knowing precisely what they cost and what economic value they generate.
African Airlines Operate With Less Room for Error
The difficulty is greater in Africa because many airlines face a combination of relatively small markets, high aviation taxes, expensive fuel, limited maintenance infrastructure, weaker currencies, fragmented air service agreements and fleets that are often too small to achieve the same economies of scale as global competitors.
The economics become particularly difficult when an African carrier earns revenue in local currency but leases aircraft, buys fuel, purchases spare parts and services debt in US dollars. Currency depreciation then raises costs even if domestic passenger demand remains unchanged. A route can be commercially attractive in local currency terms and deteriorate when translated against dollar denominated expenses.
Airport and regulatory costs also matter because African passengers frequently pay high taxes and charges relative to average income levels. This contributes to a paradox in which African airfares can be expensive while African airlines remain financially weak. The passenger sees a costly ticket, while the carrier sees a large portion of that ticket passing immediately to airports, governments, fuel suppliers, lessors and other service providers.
This is one reason the continent’s aviation challenge is not solved simply by encouraging more airlines into the market. Sustainable connectivity requires larger addressable markets, greater liberalisation, lower operating friction, deeper maintenance capability and carriers capable of matching fleet size to actual commercial demand.
The Airline Business Has Become Much More Than Selling Tickets
The most successful airlines have increasingly moved away from depending entirely on the fare printed on the passenger’s ticket. IATA expects airlines globally to generate roughly US$165 billion in ancillary revenue in 2026, with income from services such as baggage and seat selection growing faster than ticket revenue. Cargo is expected to contribute another US$162 billion.
For low cost carriers, ancillary revenue makes cheap fares possible. Ryanair earned almost €5 billion from ancillary products during FY2026, equivalent to roughly €24 for every passenger it carried.
For network airlines, loyalty programmes can be even more valuable. Airlines sell frequent flyer points to banks and credit card companies, receive cash when consumers spend through co branded cards and later provide seats when those points are redeemed. The relationship means an airline can make money from a customer buying groceries or fuel without that person boarding an aircraft.
Cargo adds another layer. Maintenance services, training academies, airport services and partnerships create further income for larger airline groups. The strongest aviation companies increasingly resemble diversified travel and financial platforms built around an airline rather than simple transport operators.
This changes the question from how much money an airline makes from a ticket to how much economic value it can extract from a passenger, an aircraft, a route and a network over time.
The Real Measure of an Airline Is Not Fleet Size or Passenger Numbers
Airlines are unusually easy to assess badly because the visible indicators are not necessarily the financially important ones. A new aircraft attracts attention. A new international destination sounds like expansion. A record passenger count suggests success. A 90 percent load factor sounds impressive. None of those figures independently demonstrates that the airline is creating economic value.
The numbers that matter are less glamorous: revenue per available seat kilometre, cost per available seat kilometre, yield, aircraft utilisation, contribution margin by route, cargo income, ancillary revenue, financing cost, fuel exposure and return on invested capital.
An airline with ten aircraft can be commercially stronger than one operating fifty. A half empty premium flight can occasionally produce more revenue than a full low fare service. An airline can increase passenger numbers while destroying shareholder value, or cut capacity while becoming more profitable.
That is why the global US$4.50 profit figure is so instructive. It reveals how little margin exists between success and failure.
Aviation is not principally a business of expensive tickets and glamorous aircraft. It is a business in which billions of dollars are invested to capture tiny differences between the cost of producing capacity and the revenue earned before that capacity disappears.
In 2026, the global industry expects to generate about US$1.17 trillion and keep only US$23 billion. Every other dollar already belongs to somebody else.
FAQ
How much profit do airlines make per passenger? IATA expects airlines globally to make approximately US$4.50 in net profit per passenger in 2026, down from US$9.10 in 2025.
How much money does the global airline industry make? Global airline revenue is expected to reach about US$1.17 trillion in 2026, while net profit is forecast at only US$23 billion, producing a net margin of around 2 percent.
How profitable is Ryanair? Ryanair reported €2.26 billion in profit after tax before exceptional items in FY2026 while carrying 208.4 million passengers, equivalent to roughly €10.84 per passenger.
How much revenue does Ethiopian Airlines generate? Ethiopian Airlines Group reported US$9.1 billion in revenue for the 2025/26 financial year and transported 20.7 million passengers.
Why can a full airline flight still lose money? A high load factor only shows that most available seats have been sold. If average fares, cargo and ancillary revenue remain below the cost of operating the flight, the airline can still lose money despite carrying a nearly full cabin.
Is Air Tanzania profitable? The Controller and Auditor General reported that Air Tanzania recorded a TSh191.19 billion net loss in 2024/25, up from TSh91.79 billion the previous year, despite government financial support.
Why did Kenya Airways lose money despite higher revenue in 2026? Kenya Airways increased first half revenue by 9 percent to KSh81 billion, but fuel costs increased by 32 percent and total operating costs rose 14 percent. The airline consequently recorded a KSh16.1 billion after tax loss.
 Uchumi360
Business Intelligence
Uchumi360
Business Intelligence
Uchumi360 covers business, investment, and economic policy across East, Central, and Southern Africa.
For the serious reader
You read to the end. That places you in a small group.
Uchumi360 is built for readers who demand precision over speed, structure over sentiment, and analysis that holds uncomfortable conclusions rather than softening them. If this work sharpens how you think about Africa's economy, help us keep building the infrastructure behind it.
Institutional Partners
Commission intelligence. Shape the conversation.
Uchumi360 works with development finance institutions, investment firms, sovereign bodies, and strategic organisations across the coverage region. Institutional partnership unlocks:
- Commissioned sector and country intelligence reports
- Branded research series under your institution's authority
- Exclusive data briefings for internal strategy teams
- Speaking and editorial presence at Uchumi360 events
- Co-published investment outlooks for your markets
Support Our Work
Independent analysis has a cost. Help us bear it.
Uchumi360 does not carry advertising. It does not take editorial direction from sponsors. Every article is produced without commercial compromise. Your contribution funds the reporting, research, and editorial infrastructure that keeps this analysis free from influence.
Secure checkout: One-time and monthly support are processed securely. Add payment credentials to enable checkout here.
Stay Connected
Keep up with every new insight.
Follow our latest analysis, policy coverage, and market intelligence as soon as it is published. If you need something specific, reach out directly and we will point you to the right research.
